
The biggest and best reason to run an ELK stack is that you have one big database (oh no, I just wrote it: big data...) for all kinds of logs. All kinds of filters in Kibana lets you find exactly what you need to (once you figured out how) and let's you create nice graphs for statistical or monitoring reasons.
But some negative points or better said potential conflicts may come across your path, too. I'm talking about mapping conflicts.
Let's assume you have the following log message arriving in Logstash and then sent to ElasticSearch:
"message": "{\"time\":\"2017-10-31T12:13:36.194Z\",\"tags\":[\"foul\",\"penalty\",\"home\"],\"action\":\"referee.decision\",\"data\":{\"team_id\":404,\"player_id\":652020}}\r",
The message runs thorugh a json filter in Logstash in order to split up the fields. By default, Logstash automatically recognizes the "time" field as a "date" format, because of it's ISO8601 format. From https://www.elastic.co/guide/en/logstash/current/plugins-filters-date.html:
"ISO8601 - should parse any valid ISO8601 timestamp, such as 2011-04-19T03:44:01.103Z"
But now another message from another application arrives:
"message": "{\"action\":\"lap.completed\",\"time\":\"01:51:560\",\"data\":{\"car_id\":23,\"pilot_id\":60}}\r",
In this message the "time" field is used for the amount of time to complete the race lap (1 minute, 51 seconds, 560ms). That's definitely not a date. But because the index is in this case the same, ElasticSearch gets confused about the mapping.
This can also be seen in Kibana under Management -> Index Patterns:
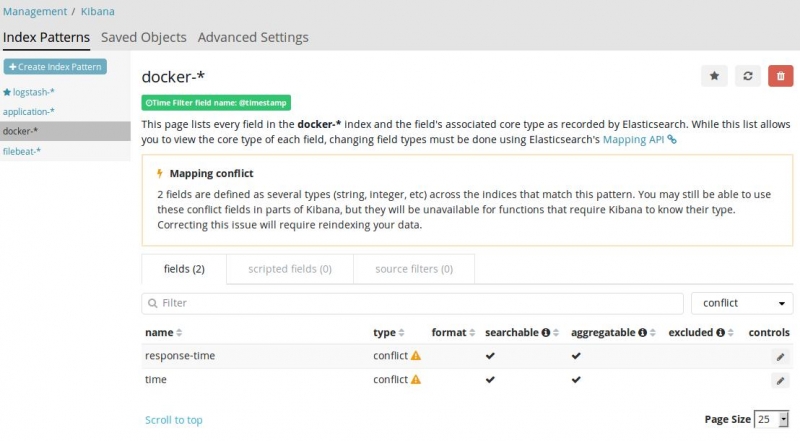
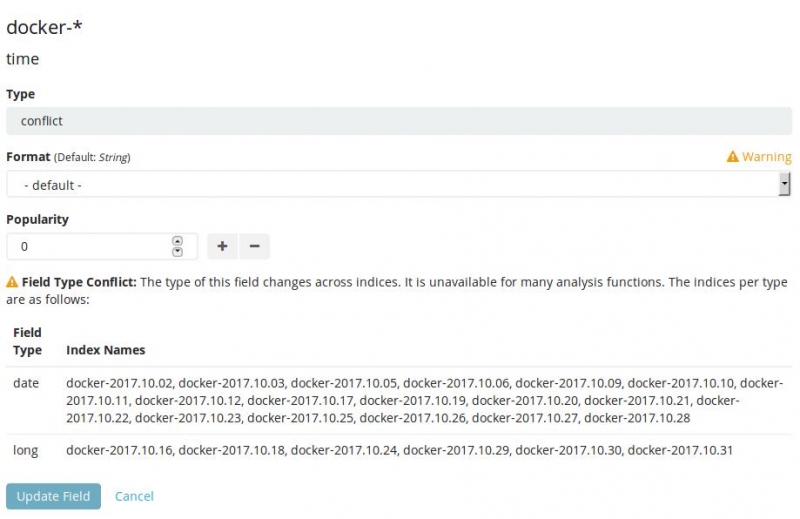
In the details of the field "time" one can see that in almost every daily index the "time" field was seen as a "date". But in certain day indexes it was seen as "long":
ElasticSearch doesn't like such mapping conflicts at all and refuses to insert the received message. Error messages will show up in the ElasticSearch log:
[2017-10-31T13:09:44,836][DEBUG][o.e.a.b.TransportShardBulkAction] [ES02] [docker-2017.10.31][0] failed to execute bulk item (index) BulkShardRequest [[docker-2017.10.31][0]] containing [index {[docker-2017.10.31][docker][AV9yVmKDj3U_Ft3cxfu2], source[{"source_host":"somehost","data":{"player_id":1325124,"team_id":52},"level":6,"created":"2017-10-24T12:06:39.663803227Z","message":"{\"time\":\"2017-10-31T12:09:44.791Z\",\"tags\":[\"foul\",\"penalty\",\"guest\"],\"action\":\"referee.decision\",\"data\":{\"team_id\":52,\"player_id\":1325124}}\r","type":"docker","version":"1.1","tags":["foul","penalty","guest"]"protocol":0,"@timestamp":"2017-10-31T12:09:44.791Z","host":"docker01","@version":"1","action":"referee.decision","time":"2017-10-31T12:09:44.791Z"}]}]
org.elasticsearch.index.mapper.MapperParsingException: failed to parse [time]
at org.elasticsearch.index.mapper.FieldMapper.parse(FieldMapper.java:298) ~[elasticsearch-5.6.0.jar:5.6.0]
at org.elasticsearch.index.mapper.DocumentParser.parseObjectOrField(DocumentParser.java:468) ~[elasticsearch-5.6.0.jar:5.6.0]
at org.elasticsearch.index.mapper.DocumentParser.parseValue(DocumentParser.java:591) ~[elasticsearch-5.6.0.jar:5.6.0]
at org.elasticsearch.index.mapper.DocumentParser.innerParseObject(DocumentParser.java:396) ~[elasticsearch-5.6.0.jar:5.6.0]
at org.elasticsearch.index.mapper.DocumentParser.parseObjectOrNested(DocumentParser.java:373) ~[elasticsearch-5.6.0.jar:5.6.0]
at org.elasticsearch.index.mapper.DocumentParser.internalParseDocument(DocumentParser.java:93) ~[elasticsearch-5.6.0.jar:5.6.0]
at org.elasticsearch.index.mapper.DocumentParser.parseDocument(DocumentParser.java:66) ~[elasticsearch-5.6.0.jar:5.6.0]
at org.elasticsearch.index.mapper.DocumentMapper.parse(DocumentMapper.java:277) ~[elasticsearch-5.6.0.jar:5.6.0]
at org.elasticsearch.index.shard.IndexShard.prepareIndex(IndexShard.java:530) ~[elasticsearch-5.6.0.jar:5.6.0]
at org.elasticsearch.index.shard.IndexShard.prepareIndexOnPrimary(IndexShard.java:507) ~[elasticsearch-5.6.0.jar:5.6.0]
at org.elasticsearch.action.bulk.TransportShardBulkAction.prepareIndexOperationOnPrimary(TransportShardBulkAction.java:458) ~[elasticsearch-5.6.0.jar:5.6.0]
at org.elasticsearch.action.bulk.TransportShardBulkAction.executeIndexRequestOnPrimary(TransportShardBulkAction.java:466) ~[elasticsearch-5.6.0.jar:5.6.0]
at org.elasticsearch.action.bulk.TransportShardBulkAction.executeBulkItemRequest(TransportShardBulkAction.java:146) [elasticsearch-5.6.0.jar:5.6.0]
at org.elasticsearch.action.bulk.TransportShardBulkAction.shardOperationOnPrimary(TransportShardBulkAction.java:115) [elasticsearch-5.6.0.jar:5.6.0]
at org.elasticsearch.action.bulk.TransportShardBulkAction.shardOperationOnPrimary(TransportShardBulkAction.java:70) [elasticsearch-5.6.0.jar:5.6.0]
at org.elasticsearch.action.support.replication.TransportReplicationAction$PrimaryShardReference.perform(TransportReplicationAction.java:975) [elasticsearch-5.6.0.jar:5.6.0]
at org.elasticsearch.action.support.replication.TransportReplicationAction$PrimaryShardReference.perform(TransportReplicationAction.java:944) [elasticsearch-5.6.0.jar:5.6.0]
at org.elasticsearch.action.support.replication.ReplicationOperation.execute(ReplicationOperation.java:113) [elasticsearch-5.6.0.jar:5.6.0]
at org.elasticsearch.action.support.replication.TransportReplicationAction$AsyncPrimaryAction.onResponse(TransportReplicationAction.java:345) [elasticsearch-5.6.0.jar:5.6.0]
at org.elasticsearch.action.support.replication.TransportReplicationAction$AsyncPrimaryAction.onResponse(TransportReplicationAction.java:270) [elasticsearch-5.6.0.jar:5.6.0]
at org.elasticsearch.action.support.replication.TransportReplicationAction$1.onResponse(TransportReplicationAction.java:924) [elasticsearch-5.6.0.jar:5.6.0]
at org.elasticsearch.action.support.replication.TransportReplicationAction$1.onResponse(TransportReplicationAction.java:921) [elasticsearch-5.6.0.jar:5.6.0]
at org.elasticsearch.index.shard.IndexShardOperationsLock.acquire(IndexShardOperationsLock.java:151) [elasticsearch-5.6.0.jar:5.6.0]
at org.elasticsearch.index.shard.IndexShard.acquirePrimaryOperationLock(IndexShard.java:1659) [elasticsearch-5.6.0.jar:5.6.0]
at org.elasticsearch.action.support.replication.TransportReplicationAction.acquirePrimaryShardReference(TransportReplicationAction.java:933) [elasticsearch-5.6.0.jar:5.6.0]
at org.elasticsearch.action.support.replication.TransportReplicationAction.access$500(TransportReplicationAction.java:92) [elasticsearch-5.6.0.jar:5.6.0]
at org.elasticsearch.action.support.replication.TransportReplicationAction$AsyncPrimaryAction.doRun(TransportReplicationAction.java:291) [elasticsearch-5.6.0.jar:5.6.0]
at org.elasticsearch.common.util.concurrent.AbstractRunnable.run(AbstractRunnable.java:37) [elasticsearch-5.6.0.jar:5.6.0]
at org.elasticsearch.action.support.replication.TransportReplicationAction$PrimaryOperationTransportHandler.messageReceived(TransportReplicationAction.java:266) [elasticsearch-5.6.0.jar:5.6.0]
at org.elasticsearch.action.support.replication.TransportReplicationAction$PrimaryOperationTransportHandler.messageReceived(TransportReplicationAction.java:248) [elasticsearch-5.6.0.jar:5.6.0]
at org.elasticsearch.transport.RequestHandlerRegistry.processMessageReceived(RequestHandlerRegistry.java:69) [elasticsearch-5.6.0.jar:5.6.0]
at org.elasticsearch.transport.TransportService$7.doRun(TransportService.java:644) [elasticsearch-5.6.0.jar:5.6.0]
at org.elasticsearch.common.util.concurrent.ThreadContext$ContextPreservingAbstractRunnable.doRun(ThreadContext.java:638) [elasticsearch-5.6.0.jar:5.6.0]
at org.elasticsearch.common.util.concurrent.AbstractRunnable.run(AbstractRunnable.java:37) [elasticsearch-5.6.0.jar:5.6.0]
at java.util.concurrent.ThreadPoolExecutor.runWorker(ThreadPoolExecutor.java:1149) [?:1.8.0_144]
at java.util.concurrent.ThreadPoolExecutor$Worker.run(ThreadPoolExecutor.java:624) [?:1.8.0_144]
at java.lang.Thread.run(Thread.java:748) [?:1.8.0_144]
Caused by: java.lang.NumberFormatException: For input string: "2017-10-31T12:09:44.791Z"
at sun.misc.FloatingDecimal.readJavaFormatString(FloatingDecimal.java:2043) ~[?:?]
at sun.misc.FloatingDecimal.parseDouble(FloatingDecimal.java:110) ~[?:?]
at java.lang.Double.parseDouble(Double.java:538) ~[?:1.8.0_144]
at org.elasticsearch.common.xcontent.support.AbstractXContentParser.longValue(AbstractXContentParser.java:187) ~[elasticsearch-5.6.0.jar:5.6.0]
at org.elasticsearch.index.mapper.NumberFieldMapper$NumberType$7.parse(NumberFieldMapper.java:737) ~[elasticsearch-5.6.0.jar:5.6.0]
at org.elasticsearch.index.mapper.NumberFieldMapper$NumberType$7.parse(NumberFieldMapper.java:709) ~[elasticsearch-5.6.0.jar:5.6.0]
at org.elasticsearch.index.mapper.NumberFieldMapper.parseCreateField(NumberFieldMapper.java:1072) ~[elasticsearch-5.6.0.jar:5.6.0]
at org.elasticsearch.index.mapper.FieldMapper.parse(FieldMapper.java:287) ~[elasticsearch-5.6.0.jar:5.6.0]
... 36 more
How can this be solved? There are of course several possibilities:
- The proper but almost impossible way: All applications writing into the same index must have a defined structure and common understanding of field names. If you can get all developers thinking the same way you're either working for the perfect company with a perfect documentation system or you're a dictator.
- Resolve the conflict: You could run all the indexes where "time" was seen as a "long" value, again through Logstash. You could add a mutate filter to force a type "date" on the "time" field. This will help for the messages using "time" as a date field, but not for other kinds of messages. You could then run the "long" indexes through Logstash again and kind of re-index the fields. Good luck...
- In my case I chose a different solution, which is by far not perfect. But I figured that all relevant messages in that index which contain a "time" field are indeed used as a date field. As this is also handled by the automatically created "@timestamp" field, I simply decided to drop the field "time" in Logstash:
filter {
if [type] == "docker" {
[...]
mutate { remove_field => [ "time" ] }
}
}
Right after this and a restart of Logstash, the following log entries appeared in ElasticSearch:
[2017-10-31T13:12:19,386][INFO ][o.e.c.m.MetaDataMappingService] [ES02] [docker-2017.10.31/kpW-7vceQWCQgza3lGK6Dg] update_mapping [docker]
[2017-10-31T13:12:28,584][INFO ][o.e.c.m.MetaDataMappingService] [ES02] [docker-2017.10.31/kpW-7vceQWCQgza3lGK6Dg] update_mapping [docker]
[2017-10-31T13:12:39,458][INFO ][o.e.c.m.MetaDataMappingService] [ES02] [docker-2017.10.31/kpW-7vceQWCQgza3lGK6Dg] update_mapping [docker]
[2017-10-31T13:13:41,338][INFO ][o.e.c.m.MetaDataMappingService] [ES02] [docker-2017.10.31/kpW-7vceQWCQgza3lGK6Dg] update_mapping [docker]
And the log entries were added into the ElasticSearch index again.
PS: Let me know in the comments if this can be handled in a better way.
ck from Switzerland wrote on Jan 2nd, 2018:
Hi babsdev. The problem in my case was that two different (internal) applications were using the same json field name with a different format and both were writing into the same index. I contacted the developer of one of the applications and he adapted the format. Since then there are no conflicts anymore.
babsdev from colorado wrote on Dec 26th, 2017:
I really appreciate your post. I have exact same issue and I was getting total confused and it happens in production now and then. We do reindexing or delete the index taking a snapshot. No perfect answer from elasticsearch guys. We have multiple applications stored logs in single index. But we are using fluentd (td-agent). Is there any better way you suggest for that? or did you find any better solution for that. Please let me know. Thanks much!

AWS Android Ansible Apache Apple Atlassian BSD Backup Bash Bluecoat CMS Chef Cloud Coding Consul Containers CouchDB DB DNS Database Databases Docker ELK Elasticsearch Filebeat FreeBSD Galera Git GlusterFS Grafana Graphics HAProxy HTML Hacks Hardware Icinga Icingaweb Icingaweb2 Influx Internet Java KVM Kibana Kodi Kubernetes LVM LXC Linux Logstash Mac Macintosh Mail MariaDB Minio MongoDB Monitoring Multimedia MySQL NFS Nagios Network Nginx OSSEC OTRS Office PGSQL PHP Perl Personal PostgreSQL Postgres PowerDNS Proxmox Proxy Python Rancher Rant Redis Roundcube SSL Samba Seafile Security Shell SmartOS Solaris Surveillance Systemd TLS Tomcat Ubuntu Unix VMWare VMware Varnish Virtualization Windows Wireless Wordpress Wyse ZFS Zoneminder