
In the past weeks I've spent quite some time (whenever I had time) to slowly kick off the new monitoring architecture using a dual-master Icinga2 installation, InfluxDB as graphing database and Grafana as graph displaying software. See previous articles "Icinga2 graphing with InfluxDB and Grafana" and "Create separate measurement tables in InfluxDB for Icinga 2 NRPE checks" for further information.
I was quite happy so far with the dashboard I created in Grafana, based on the Icinga2 Grafana dashboard template:
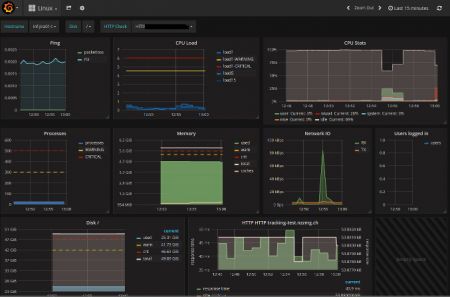
But I was missing some dynamic graphs showing up. We currently have around 850 host objects in our "old" Icinga2 monitoring and not all the hosts are the same. Some have additional database checks, some have HTTP checks, some are running on Windows, others again have very specific application checks. It's difficult in the main dashboard to represent all the services with the (fixed) graph elements in Grafana.
Eventually I came across a question from user TryTryAgain on serverfault, which was basically more about creating a dynamic action_url to point to Grafana. The question itself was irrelvant to me, but something interesting hit my eye:
" I'd like this to work: action_url = "http://grafana-server.example/grafana/dashboard/db/generic-check?var-device=$HOSTNAME$&var-check=$SERVICEDESC$&var-checkmetric=$SERVICECHECKCOMMAND$&var-datatype=perfdata&var-value=value" "
So the user prepared a new template "generic-check" and uses dynamic variables to display the graph for one exact service. That's a great idea!
As I couldn't find a pre-existing template for such a generic graph, I went on to create it. And had to dig deeper into InfluxDB's queries and schemas...
1. Prepare the graph
I added a single graph, first with a static data query:
SELECT mean("value") FROM hostalive WHERE ("hostname" =~ /mytesthost/) AND $timeFilter GROUP BY time($__interval) fill(previous)
This graph needs to be adjusted in the next steps, as I added dynamic variables.
2. Variable $hostname
I decided I want the generic service template to start with the actual host object. This is usually the most important marker (from which host object do I need the graph?). I created the $hostname variable in the template's templating variables:
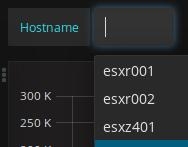
$hostname = SHOW TAG VALUES FROM "hostalive" WITH KEY = "hostname"
This query looks up the "hostalive" measurements table and shows all unique values of the key "hostname". Remember, InfluxDB is basically explained a key-value store (like Redis).
This one was pretty easy and immediately showed up all the hosts prepared in the new Icinga2 architecture:
To use the dynamic variable $hostname in the graph, the graph's query needs to be adjusted:
SELECT mean("value") FROM hostalive WHERE ("hostname" =~ /^$hostname$/) AND $timeFilter GROUP BY time($__interval) fill(previous)
3. Variable $check
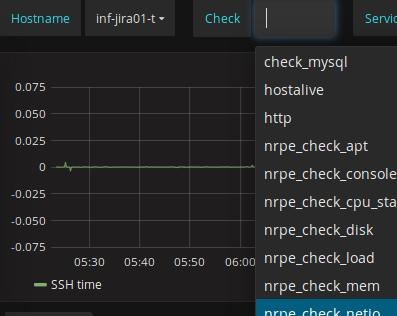
Now it gets slightly more complicated. Now that the host object is selected by using $hostname, Grafana needs to look up for which services it is able to display graphs. I decided the best way would be to look into the different measurement tables. I did this by:
$check = SHOW measurements
But I wasn't happy with that because it just showed all measurement tables, even irrelevant ones like "http" for a non-webserver.
Luckily the show measurements query also allows a WHERE clause:
$check = SHOW measurements WHERE "hostname" =~ /^$hostname$/
This way InfluxDB only shows measurement tables in which our already selected host object has already some data entries.
To use the dynamic variable $check in the graph, the graph's query needs to be adjusted:
SELECT mean("value") FROM /^$check$/ WHERE ("hostname" =~ /^$hostname$/) AND $timeFilter GROUP BY time($__interval) fill(previous)
4. Variable $service
At first I thought my template is almost complete with the defined $check. It worked for example for "ssh" checks, which is (normally) a single service check on the host object. But a very good example disproving it is a disk check: You usually run disk usage checks (check_disk) on several partitions on the same host object, having therefore multiple service objects in Icinga 2. In such a case, the query of the selected $check returns multiple results. A graph would then simply take all the data together (value), whether the value came from a partition "/" or "/tmp". This is wrong.
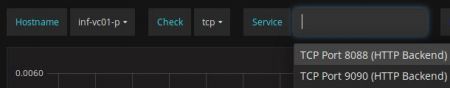
So I needed to create another variable $service which represents the already existing data for the selected $check:
$service = SHOW TAG VALUES FROM $check WITH KEY = "service" WHERE "hostname" =~ /^$hostname$/
In the following example, a host object with several tcp checks gives the following selection:
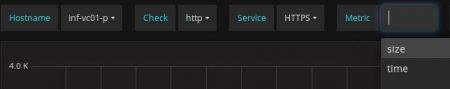
5. Variable $metric
But a check can return multiple values! For example a check_http usually returns two sets of performance data: The size of the response and the time of the response (response time). To get the graph we actually want, for example response time of a http check, another flexible variable $metric was defined:
$metric = SHOW TAG VALUES FROM "$check" WITH KEY = "metric" WHERE "hostname" =~ /^$hostname$/
The new variable now allows to select the relevant data:
To use the dynamic variable $metric in the graph, the graph's query needs to be adjusted:
SELECT mean("value") FROM /^$check$/ WHERE ("hostname" =~ /^$hostname$/ AND "metric" =~ /^$metric$/) AND $timeFilter GROUP BY time($__interval) fill(previous)
6. Variable $aggregation
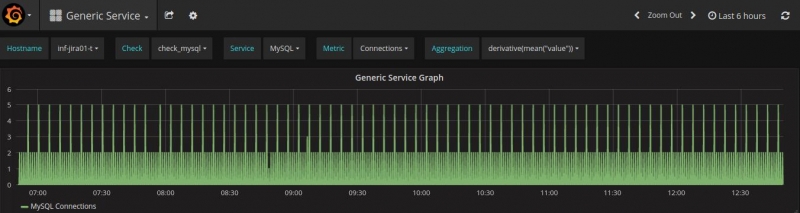
I thought I was done and the first few tests looked promising. Until I came across a host having a MySQL running on it. The graphs for MySQL (metric: connections) just grew:
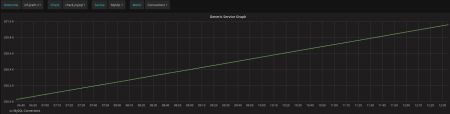
This is a misinterpretation by the graph because the MySQL connections is a so-called counter (connection = connection +1). Because this is a single graph, how does Grafana know what kind of data it gets?
The solution is to provide yet another dynamic variable $aggregation. With this variable, Grafana can be told how to display the data. I created a custom variable for this purpose with two values:
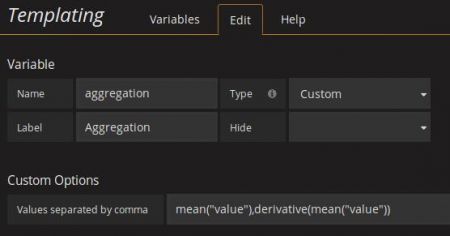
$aggregation = mean("value"),derivative(mean("value"))
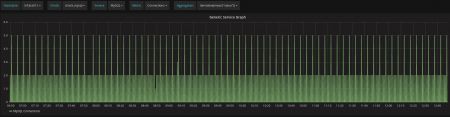
To use the dynamic variable $aggregation in the graph, the graph's query needs to be adjusted:
SELECT $aggregation FROM /^$check$/ WHERE ("hostname" =~ /^$hostname$/ AND "metric" =~ /^$metric$/) AND $timeFilter GROUP BY time($__interval) fill(previous)
The graph for the counter data now dynamically adapts:
The full picture
The template "Generic Service" can be downloaded here as json export.
Next steps
Now being able to dynamically show up a graph for a generic service (by manually selecting the values from the drop down fields or by using the variables in the URL), I will try to use that somehow for the "action_url" in Icinga 2 or integrate it differently.
Open issues:
The graphs for disk/partition usage are not showing up due to an error in the query. I haven't found out yet why this happens (probably due to a conflict between $service and $metric, not sure) but for now I can live with it.
ck from Switzerland wrote on Aug 14th, 2023:
Hi Dave, nice to hear from you. No, I personally have not used InfluxDB 2.x yet. Will probably hit the upgrade later this year.
Dave Kempe from Australia wrote on Aug 14th, 2023:
Nice work. Did you happen to figure out a similar one for influxdb2? I will work on it as well, but in case you have a magic snippet somewhere, it would save me some time.

AWS Android Ansible Apache Apple Atlassian BSD Backup Bash Bluecoat CMS Chef Cloud Coding Consul Containers CouchDB DB DNS Database Databases Docker ELK Elasticsearch Filebeat FreeBSD Galera Git GlusterFS Grafana Graphics HAProxy HTML Hacks Hardware Icinga Icingaweb Icingaweb2 Influx Internet Java KVM Kibana Kodi Kubernetes LVM LXC Linux Logstash Mac Macintosh Mail MariaDB Minio MongoDB Monitoring Multimedia MySQL NFS Nagios Network Nginx OSSEC OTRS Office PGSQL PHP Perl Personal PostgreSQL Postgres PowerDNS Proxmox Proxy Python Rancher Rant Redis Roundcube SSL Samba Seafile Security Shell SmartOS Solaris Surveillance Systemd TLS Tomcat Ubuntu Unix VMWare VMware Varnish Virtualization Windows Wireless Wordpress Wyse ZFS Zoneminder