Last update: December 10, 2024
This is a monitoring plugin to check the status of an ElasticSearch (or OpenSearch) cluster or node. Besides the classical status check (green, yellow, red) this plugin also allows to monitor resouce usage (cpu, disk, memory) of the cluster or even on local cluster nodes (-L).
Besides that, the plugin offers additional (advanced) checks of a Elasticsearch node/cluster (Java Threads, Thread Pool Statistics, Master Verification, Read-Only Indexes, ...).
If you are looking for commercial support for this monitoring plugin, need customized modifications or in general customized monitoring plugins, contact us at Infiniroot.com.

213387 downloads so far...
Download plugin and save it in your Nagios/Monitoring plugin folder (usually /usr/lib/nagios/plugins, depends on your distribution). Afterwards adjust the permissions (usually chmod 755).
Community contributions welcome on GitHub repo.
20160429: Started programming plugin
20160601: Continued programming. Working now as it should =)
20160906: Added memory usage check, check types option (-t)
20160906: Renamed plugin from check_es_store to check_es_system
20160907: Change internal referenced variable name for available size
20160907: Output now contains both used and available sizes
20161017: Add missing -t in usage output
20180105: Fix if statement for authentication (@deric)
20180105: Fix authentication when wrong credentials were used
20180313: Configure max_time for Elastic to respond (@deric)
20190219: Fix alternative subject name in ssl (issue 4), direct to auth
20190220 1.1: Added status check type
20190403 1.2: Check for mandatory parameter checktype, adjust help
20190403 1.3: Catch connection refused error
20190426 1.4: Catch unauthorized (403) error
20190626 1.5: Added readonly check type
20190905 1.5.1: Catch empty cluster health status (issue #13)
20190909 1.6: Added jthreads and tps (thread pool statistics) check types, handle correct curl return codes
20190924 1.6.1: Missing 'than' in tps output
20191104 1.7: Added master check type
20200401 1.7.1: Fix/handle 503 errors with curl exit code 0 (issue #20)
20200409 1.7.2: Fix 503 error lookup (issue #22)
20200430 1.8: Support both jshon and jq as json parsers (issue #18)
20200609 1.8.1: Fix readonly check on ALL indices (issue #26)
20200723 1.9: Add cluster name to status output
20200824 1.9.1: Fix typo in readonly check output
20200916 1.10: Internal renaming of -i parameter, use for tps check (issue #28)
20201110 1.10.1: Fix thresholds in jthreads check
20201125 1.11.0: Show names of read_only indexes with jq, set jq as default parser
20210616 1.11.1: Fix authentication bug (#38) and non ES URL responding (#39)
20211202 1.12.0: Added local node (-L), SSL settings (-K, -E), cpu check
20230929 1.12.1: Bugfix in readonly check type for missing privileges
20240906 1.13.0: Improving code, fix cert based auth on certain types (#53)
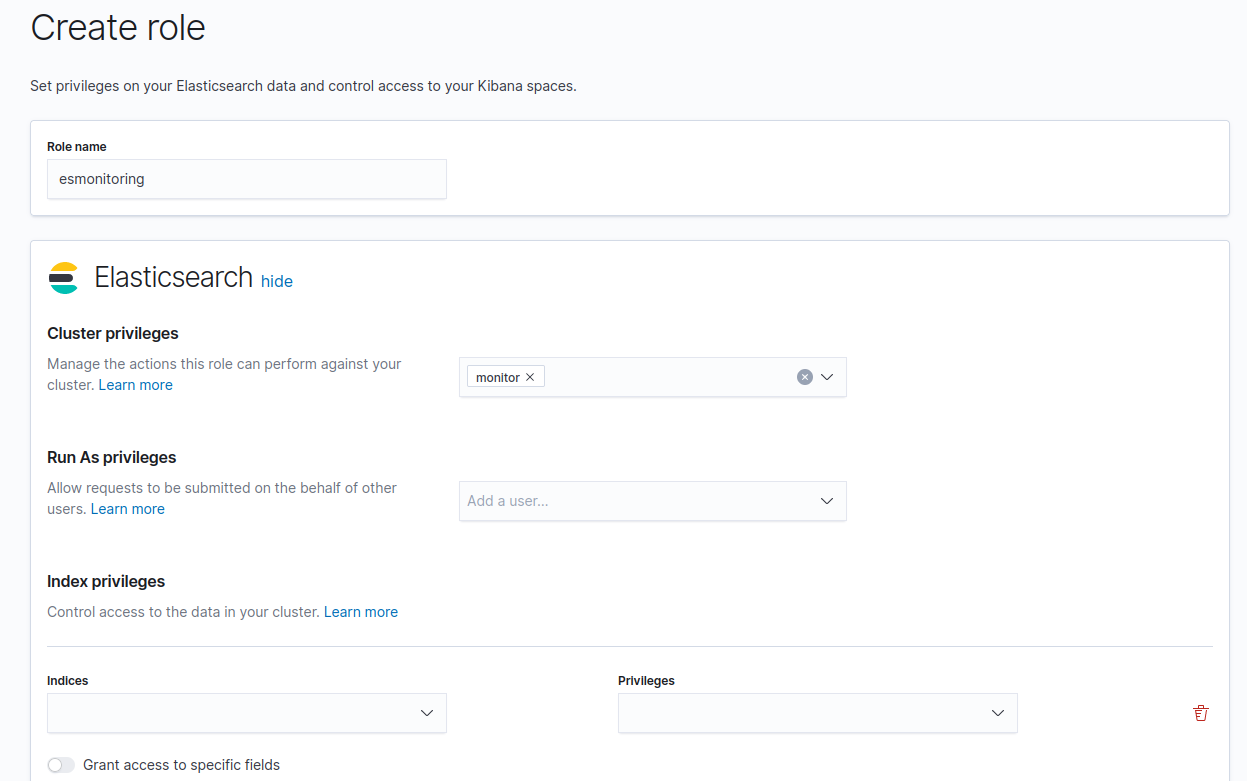
If you are using authenticated access to Elasticsearch, the user needs 'monitor' cluster privileges. The easiest way to do this is to use Kibana to create a new role (here named esmonitoring) with the 'monitor' cluster privilege:
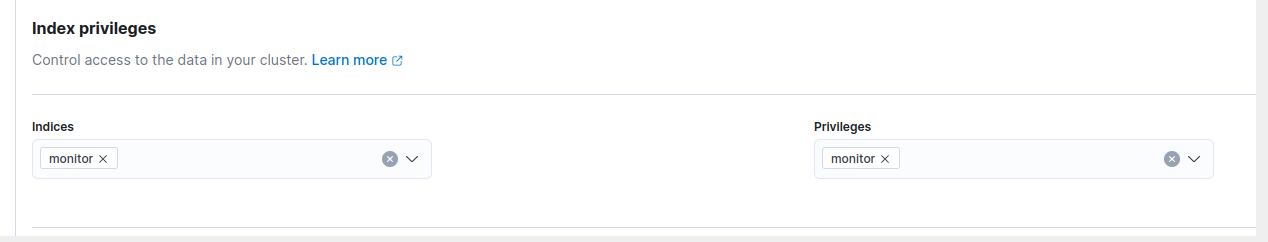
For the readonly check type, an additional index privilege needs to be created. On the index 'monitor' add the privilege 'monitor' to the role you created:
Then create a new user (here named esmonitoring) with the role you just created:

| Parameter | Description |
| -H* | Hostname or ip address of ElasticSearch Node |
| -P | Port (defaults to 9200) |
| -S | Use secure http (https) |
| -L | Run check on local node instead of cluster (supported check types: cpu, mem, disk, jthreads) |
| -u | Username if authentication is required |
| -p | Password if authentication is required |
| -E | SSL certificate(s) for authentication |
| -K | SSL key for authentication |
| -t* | Type of check to run (see definition of the check types below) |
| -d+ | Available disk or memory size (ex. 20) |
| -o | Size unit (K|M|G) (defaults to G) |
| -i | Space separated list of included object names to be checked (index names on readonly check, pool names on tps check) |
| -w | Warning threshold Threshold format for 'disk' and 'mem': int (for percent), defaults to 80 (warn) and 95 (crit) Threshold format for 'tps': int,int,int (active, queued, rejected), no defaults Threshold format for all other check types': int, no defaults |
| -c | Critical threshold Threshold format for 'disk' and 'mem': int (for percent), defaults to 80 (warn) and 95 (crit) Threshold format for 'tps': int,int,int (active, queued, rejected), no defaults Threshold format for all other check types': int, no defaults |
| -m | Maximum time in seconds to wait for Elasticsearch server response (default: 30) |
| -e | The given node is expected to be the master node of the Elasticsearch cluster (only affects 'master' check) |
| -X | json parser to use, can either be jshon or jq (default: jq) |
| -h | Help! |
* mandatory parameter
+ disabled parameter since version 1.12.0 (was mandatory for check types disk and mem)
| Type | Description |
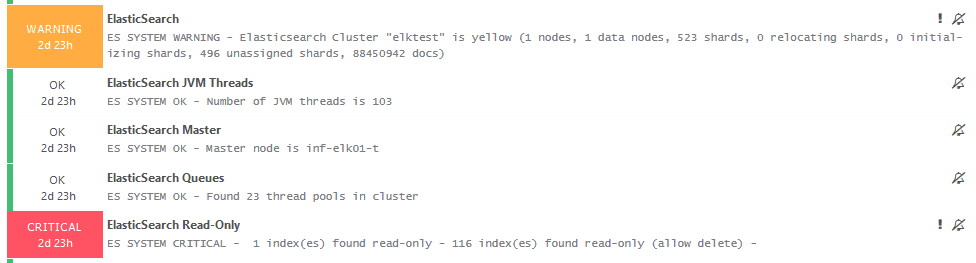
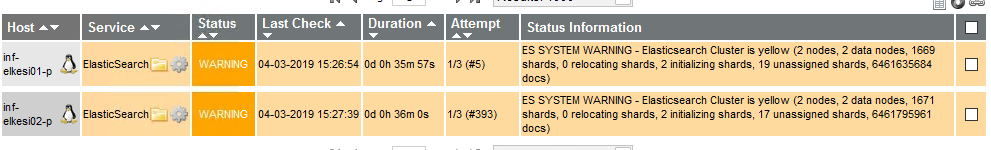
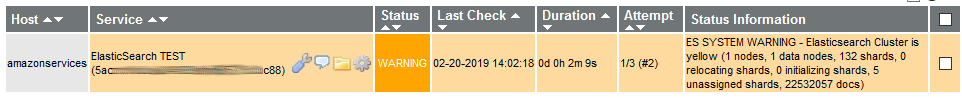
| status | Check the current status of the cluster (green, yellow, red). Besides that shows additional information (nodes, shards, docs). When the status is yellow or red, the relevant shard information is shown (e.g. initializing or unassigned).. |
| cpu | Check the current CPU usage. Thresholds possible. |
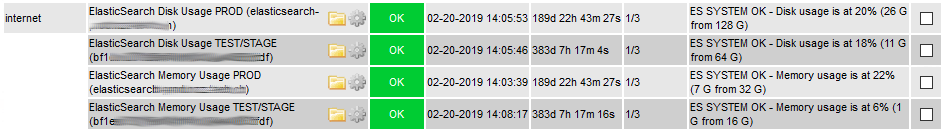
| mem | Check the current memory usage. Thresholds possible. |
| disk | Check the current disk usage. Thresholds possible. Note: Only measures usage of Elasticsearch, not full server usage! |
| readonly | Check all (default: _all) or index(es) listed with -i parameter for read-only flag. When using jq as parser, the plugin will show the names of the read-only index(es). |
| jthreads | Monitor the number of Java threads across the ES cluster. Thresholds possible. |
| tps | Monitor the thread pool statistics across ES cluster. For each thread pool the 'active', 'queued' and 'rejected' queues are checked. A high and increasing number of certain queues can indicate problems with your Elasticsearch cluster. Can be limited to certain thread pools using -i parameter. Thresholds possible. |
| master | Monitor the current master node of the ES cluster. The parameter -e can be used to check for a certain node to be master and alert if this is not the case. |
Usage:
./check_es_system.sh -H ESURL [-P port] [-S] [-u user -p pass|-E cert -K key] -t checktype [-o unit] [-w int] [-c int] [-m int] [-e string] [-X string]
Example: Classical status check. Here the Elasticsearch cluster runs on escluster.example.com and is accessed using HTTPS (-S to enable https) on port 9243 using the basic auth credentials user and password. The output shows the cluster status (green) and some additional information.
As performance data the node numbers, shard information and total number of documents are used.
Note: When the status changes to yellow (= WARNING) or red (=CRITICAL) the output also contains information of relocating, initializing and unassigned shards. The performance data stays the same to not confuse graphing databases.
./check_es_system.sh -H escluster.example.com -P 9243 -S -u user -p password -t status
ES SYSTEM OK - Elasticsearch Cluster is green (3 nodes, 2 data nodes, 114 shards, 8426885 docs)|total_nodes=3;;;; data_nodes=2;;;; total_shards=114;;;; relocating_shards=0;;;; initializing_shards=0;;;; unassigned_shards=0;;;; docs=8426885;;;;
Example: Status check on OpenSearch. The plugin also supports OpenSearch (to a certain degree). At least you can run the plugin 1:1 on an OpenSearch cluster to check the status API.
./check_es_system.sh -H localhost -t status
ES SYSTEM OK - Elasticsearch Cluster "opensearch" is green (1 nodes, 1 data nodes, 3 shards, 453 docs)|total_nodes=1;;;; data_nodes=1;;;; total_shards=3;;;; relocating_shards=0;;;; initializing_shards=0;;;; unassigned_shards=0;;;; docs=453;;;;
Example: CPU usage check. To check the current CPU usage of the cluster:
./check_es_system.sh -H escluster.example.com -P 9243 -S -u user -p password -t cpu
ES SYSTEM CRITICAL - CPU usage is at 98% |es_cpu=98%;80;95;0;100
Example: Disk usage (cluster) check. We want to know the current disk usage of the cluster:
./check_es_system.sh -H escluster.example.com -P 9243 -S -u user -p password -t disk
ES SYSTEM OK - Disk usage is at 22% (105 G from 470 G)|es_disk=112912303491B;404114689228;479886193459;0;505143361536
Example: Disk usage (local node) check. If we have direct access to the cluster node(s), the disk usage of a specific node can be checked by using the -L parameter:
./check_es_system.sh -H node1.example.com -P 9243 -S -u user -p password -t disk -L
ES SYSTEM OK - Disk usage is at 20% (23 G from 117 G)|es_disk=25317853327B;101028672307;119971548364;0;126285840384
Example: Memory usage check. We want to know the current memory usage of the Elasticsearch cluster:
./check_es_system.sh -H escluster.example.com -P 9243 -S -u user -p password -t mem
ES SYSTEM OK - Memory usage is at 58% (14 G from 24 G)|es_memory=15107616304B;20615843020;24481313587;;
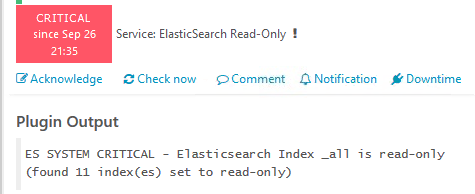
Example: Readonly index check. The plugin checks the mentioned indexes, using the -i parameter, for a read-only flag. If no -i parameter was used, all indexes will be checked.
./check_es_system.sh -H escluster.example.com -P 9243 -S -u user -p password -t readonly -i "filebeat- *logstash-*"
CRITICAL - Elasticsearch Index filebeat- *is read-only (found 53 index(es) set to read-only) Elasticsearch Index logstash-* is read-only (found 125 index(es) set to read-only)
Example: Readonly index check with jq as parser (default since version 1.11.0). Note the output now shows the found read only indexes. The output also differs between read_only and read_only_allow_delete marked indexes.
./check_es_system.sh -H escluster.example.com -P 9243 -S -u user -p password -t readonly
ES SYSTEM CRITICAL - 1 index(es) found read-only claudiotest - 116 index(es) found read-only (allow delete) logstash-2020.09.21 logstash-2020.09.04 filebeat-2020.09.04 .monitoring-es-6-2020.09.21 idx filebeat-2020.09.08 filebeat-2020.09.07 filebeat-2020.09.01 claudiotest2 .management-beats logstash-2020.09.05 filebeat-2020.09.10 logstash-2020.09.06 .triggered_watches-6 logstash-2020.09.02 filebeat-2020.09.21 logstash-2020.09.03 .monitoring-kibana-6-2020.09.21 filebeat-2020.09.03 logstash-2020.09.01 logstash-2020.09.08 kibana_sample_data_logs .kibana_7 .kibana_task_manager filebeat-2020.09.05 .security-6 .watches filebeat-2020.09.11 filebeat-2020.09.09 .kibana-6 filebeat-2020.09.02 logstash-2020.09.07 filebeat-2020.09.06
Example: JVM Threads check. The plugin checks the number of JVM threads across the cluster. The plugin should warn when 200 or more threads are running, critical at 300 or more threads.
./check_es_system.sh -H escluster.example.com -P 9243 -S -u user -p password -t jthreads -w 200 -c 300
ES SYSTEM CRITICAL - Number of JVM threads is 319|es_jvm_threads=319;200;300;;
Example: TPS (Thread Pool Statistics). The plugin goes through all the detected thread pools of the cluster. Without thresholds, the plugin just outputs the number of detected thread pools and adds performance data. With thresholds (note the special format!), the plugin will alert if one of the thread pools is equal to or above a threshold.
./check_es_system.sh -H escluster.example.com -P 9243 -S -u user -p password -t tps -w 200 -c 300
ES SYSTEM OK - Found 46 thread pools in cluster|tp_es02-analyze_active=0;10;50;; tp_es02-analyze_queue=0;50;200;; tp_es02-analyze_rejected=0;1000;2000;; tp_es02-ccr_active=0;10;50;; tp_es02-ccr_queue=0;50;200;; tp_es02-ccr_rejected=0;1000;2000;; tp_es02-fetch_shard_started_active=0;10;50;; tp_es02-fetch_shard_started_queue=0;50;200;; tp_es02-fetch_shard_started_rejected=0;1000;2000;; tp_es02-fetch_shard_store_active=0;10;50;; tp_es02-fetch_shard_store_queue=0;50;200;; tp_es02-fetch_shard_store_rejected=0;1000;2000;; tp_es02-flush_active=0;10;50;; tp_es02-flush_queue=0;50;200;; tp_es02-flush_rejected=0;1000;2000;; tp_es02-force_merge_active=0;10;50;; tp_es02-force_merge_queue=0;50;200;; tp_es02-force_merge_rejected=0;1000;2000;; tp_es02-generic_active=0;10;50;; tp_es02-generic_queue=0;50;200;; tp_es02-generic_rejected=0;1000;2000;; tp_es02-get_active=0;10;50;; tp_es02-get_queue=0;50;200;; tp_es02-get_rejected=0;1000;2000;; tp_es02-index_active=0;10;50;; tp_es02-index_queue=0;50;200;; tp_es02-index_rejected=0;1000;2000;; tp_es02-listener_active=0;10;50;; tp_es02-listener_queue=0;50;200;; tp_es02-listener_rejected=0;1000;2000;; tp_es02-management_active=1;10;50;; tp_es02-management_queue=0;50;200;; tp_es02-management_rejected=0;1000;2000;; tp_es02-ml_autodetect_active=0;10;50;; tp_es02-ml_autodetect_queue=0;50;200;; tp_es02-ml_autodetect_rejected=0;1000;2000;; tp_es02-ml_datafeed_active=0;10;50;; tp_es02-ml_datafeed_queue=0;50;200;; tp_es02-ml_datafeed_rejected=0;1000;2000;; tp_es02-ml_utility_active=0;10;50;; tp_es02-ml_utility_queue=0;50;200;; tp_es02-ml_utility_rejected=0;1000;2000;; tp_es02-refresh_active=1;10;50;; tp_es02-refresh_queue=0;50;200;; tp_es02-refresh_rejected=0;1000;2000;; tp_es02-rollup_indexing_active=0;10;50;; tp_es02-rollup_indexing_queue=0;50;200;; tp_es02-rollup_indexing_rejected=0;1000;2000;; tp_es02-search_active=0;10;50;; tp_es02-search_queue=0;50;200;; tp_es02-search_rejected=0;1000;2000;; tp_es02-search_throttled_active=0;10;50;; tp_es02-search_throttled_queue=0;50;200;; tp_es02-search_throttled_rejected=0;1000;2000;; tp_es02-security-token-key_active=0;10;50;; tp_es02-security-token-key_queue=0;50;200;; tp_es02-security-token-key_rejected=0;1000;2000;; tp_es02-snapshot_active=0;10;50;; tp_es02-snapshot_queue=0;50;200;; tp_es02-snapshot_rejected=0;1000;2000;; tp_es02-warmer_active=0;10;50;; tp_es02-warmer_queue=0;50;200;; tp_es02-warmer_rejected=0;1000;2000;; tp_es02-watcher_active=0;10;50;; tp_es02-watcher_queue=0;50;200;; tp_es02-watcher_rejected=0;1000;2000;; tp_es02-write_active=8;10;50;; tp_es02-write_queue=10;50;200;; tp_es02-write_rejected=0;1000;2000;; tp_es01-analyze_active=0;10;50;; tp_es01-analyze_queue=0;50;200;; tp_es01-analyze_rejected=0;1000;2000;; tp_es01-ccr_active=0;10;50;; tp_es01-ccr_queue=0;50;200;; tp_es01-ccr_rejected=0;1000;2000;; tp_es01-fetch_shard_started_active=0;10;50;; tp_es01-fetch_shard_started_queue=0;50;200;; tp_es01-fetch_shard_started_rejected=0;1000;2000;; tp_es01-fetch_shard_store_active=0;10;50;; tp_es01-fetch_shard_store_queue=0;50;200;; tp_es01-fetch_shard_store_rejected=0;1000;2000;; tp_es01-flush_active=0;10;50;; tp_es01-flush_queue=0;50;200;; tp_es01-flush_rejected=0;1000;2000;; tp_es01-force_merge_active=0;10;50;; tp_es01-force_merge_queue=0;50;200;; tp_es01-force_merge_rejected=0;1000;2000;; tp_es01-generic_active=0;10;50;; tp_es01-generic_queue=0;50;200;; tp_es01-generic_rejected=0;1000;2000;; tp_es01-get_active=0;10;50;; tp_es01-get_queue=0;50;200;; tp_es01-get_rejected=0;1000;2000;; tp_es01-index_active=0;10;50;; tp_es01-index_queue=0;50;200;; tp_es01-index_rejected=0;1000;2000;; tp_es01-listener_active=0;10;50;; tp_es01-listener_queue=0;50;200;; tp_es01-listener_rejected=0;1000;2000;; tp_es01-management_active=1;10;50;; tp_es01-management_queue=0;50;200;; tp_es01-management_rejected=0;1000;2000;; tp_es01-ml_autodetect_active=0;10;50;; tp_es01-ml_autodetect_queue=0;50;200;; tp_es01-ml_autodetect_rejected=0;1000;2000;; tp_es01-ml_datafeed_active=0;10;50;; tp_es01-ml_datafeed_queue=0;50;200;; tp_es01-ml_datafeed_rejected=0;1000;2000;; tp_es01-ml_utility_active=0;10;50;; tp_es01-ml_utility_queue=0;50;200;; tp_es01-ml_utility_rejected=0;1000;2000;; tp_es01-refresh_active=0;10;50;; tp_es01-refresh_queue=0;50;200;; tp_es01-refresh_rejected=0;1000;2000;; tp_es01-rollup_indexing_active=0;10;50;; tp_es01-rollup_indexing_queue=0;50;200;; tp_es01-rollup_indexing_rejected=0;1000;2000;; tp_es01-search_active=0;10;50;; tp_es01-search_queue=0;50;200;; tp_es01-search_rejected=78;1000;2000;; tp_es01-search_throttled_active=0;10;50;; tp_es01-search_throttled_queue=0;50;200;; tp_es01-search_throttled_rejected=0;1000;2000;; tp_es01-security-token-key_active=0;10;50;; tp_es01-security-token-key_queue=0;50;200;; tp_es01-security-token-key_rejected=0;1000;2000;; tp_es01-snapshot_active=0;10;50;; tp_es01-snapshot_queue=0;50;200;; tp_es01-snapshot_rejected=0;1000;2000;; tp_es01-warmer_active=0;10;50;; tp_es01-warmer_queue=0;50;200;; tp_es01-warmer_rejected=0;1000;2000;; tp_es01-watcher_active=0;10;50;; tp_es01-watcher_queue=0;50;200;; tp_es01-watcher_rejected=0;1000;2000;; tp_es01-write_active=8;10;50;; tp_es01-write_queue=20;50;200;; tp_es01-write_rejected=0;1000;2000;;
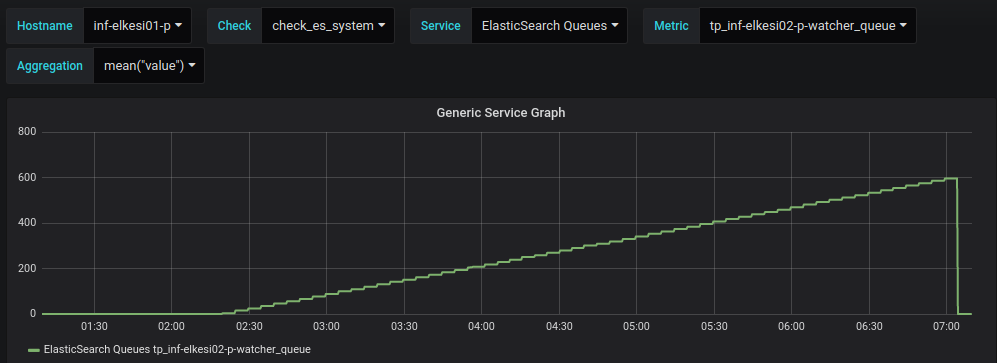
Example: TPS (Thread Pool Statistics) as before but only monitor watcher queues the cluster.
./check_es_system.sh -H escluster.example.com -P 9243 -S -u user -p password -t tps -i "watcher"
ES SYSTEM OK - Found 3 thread pools in cluster|tp_elastic02-p-watcher_active=0;;;; tp_elastic02-p-watcher_queue=0;;;; tp_elastic02-p-watcher_rejected=0;;;; tp_elastic01-p-watcher_active=5;;;; tp_elastic01-p-watcher_queue=0;;;; tp_elastic01-p-watcher_rejected=0;;;; tp_elastic03-p-watcher_active=0;;;; tp_elastic03-p-watcher_queue=0;;;; tp_elastic03-p-watcher_rejected=0;;;;
Example: Master Check. The plugin checks which node of the given Elasticsearch cluster is the current master node. With the optional parameter -e (expect master) a node name can be given. If the given node name and the cluster's current master node differ, the plugin will alert with a warning.
./check_es_system.sh -H escluster.example.com -P 9243 -S -u user -p password -t master -e node1
ES SYSTEM WARNING - Master node is node2 but expected node1
The following command definition allows optional parameters all defined within ARG4.
# 'check_es_system' command definition
define command{
command_name check_es_system
command_line $USER1$/check_es_system.sh -H $ARG1$ -t $ARG3$ $ARG4$
}
object CheckCommand "check_es_system" {
import "plugin-check-command"
command = [ PluginContribDir + "/check_es_system.sh" ]
arguments = {
"-H" = {
value = "$es_address$"
description = "Hostname
or IP Address of ElasticSearch node"
}
"-P" = {
value = "$es_port$"
description = "Port number
(default: 9200)"
}
"-S" = {
set_if = "$es_ssl$"
description = "Use https"
}
"-u" = {
value = "$es_user$"
description = "Username
if authentication is required"
}
"-p" = {
value = "$es_password$"
description = "Password
if authentication is required"
}
"-t" = {
value = "$es_checktype$"
description = "Define the
type of check (disk|mem|status)"
}
"-o" = {
value = "$es_unit$"
description = "Choose sizing
unit (K|M|G) - defaults to G for GigaByte"
}
"-L" = {
set_if = "$es_local$"
description = "Execute check on local node instead of cluster (supports cpu, disk, mem, jthreads)"
}
"-i" = {
value = "$es_include$"
description = "Space separated list of included object names to be checked (index names on readonly check, pool names on tps check)"
}
"-w" = {
value = "$es_warn$"
description = "Warning threshold"
}
"-c" = {
value = "$es_crit$"
description = "Critical threshold"
}
"-m" = {
value = "$es_max_time$"
description = "Maximum
time in seconds (timeout) for Elasticsearch to respond (default: 30)"
}
"-e" = {
value = "$es_expect_master$"
description = "The given node name is expected to be the master node of the Elasticsearch cluster"
}
"-X" = {
value = "$es_json_parser$"
description = "json parser to use, can either be jshon or jq (default: jq)"
}
}
vars.es_address = "$address$"
vars.es_ssl = false
vars.es_local = false
}
In this example, the disk check happens on myexcluster.in.the.cloud and assumes a 50GB available disk space. There is authentication required to access the cluster statistics so here the login happens with user "read" and password "only".
# Check ElasticSearch Disk Usage
define service{
use generic-service
host_name myesnode
service_description ElasticSearch Disk Usage
check_command check_es_system!myescluster.in.the.cloud!disk!-u read -p only
}
In the next example, the status of the Elasticsearch cluster is checked on myexcluster.in.the.cloud:
# Check ElasticSearch Status
define service{
use generic-service
host_name myesnode
service_description ElasticSearch Status
check_command check_es_system!myescluster.in.the.cloud!status
}
In this example, the disk check happens on myexcluster.in.the.cloud. There is authentication required to access the cluster statistics so here the login happens with user "read" and password "only".
# Check Elasticsearch Disk Usage
object Service "ElasticSearch Disk Usage" {
import "generic-service"
host_name = "myesnode"
check_command = "check_es_system"
vars.es_address = "myescluster.in.the.cloud"
vars.es_user = "read"
vars.es_password = "only"
vars.es_checktype = "disk"
}
In this example, the disk check happens on a specific cluster node (esnode1.in.the.cloud) and we want to check the nodes own local usage. There is authentication required to access the cluster statistics so here the login happens with user "read" and password "only".
# Check Elasticsearch Disk Usage
object Service "ElasticSearch Disk Usage" {
import "generic-service"
host_name = "myesnode"
check_command = "check_es_system"
vars.es_address = "myescluster.in.the.cloud"
vars.es_user = "read"
vars.es_password = "only"
vars.es_checktype = "disk"
vars.es_local = true
}
In this example, the status of Elasticsearch running on myexcluster.in.the.cloud is checked. There is authentication required to access the cluster statistics so here the login happens with user "read" and password "only".
# Check Elasticsearch Status
object Service "ElasticSearch Status" {
import "generic-service"
host_name = "myesnode"
check_command = "check_es_system"
vars.es_address = "myescluster.in.the.cloud"
vars.es_user = "read"
vars.es_password = "only"
vars.es_checktype = "status"
}
In this example, the thread pool statistics of Elasticsearch running on myexcluster.in.the.cloud are checked. If any of the thread pool stats (active,queued,rejected) triggers a treshold, the plugin will exit with warning or critical status.
# Check Elasticsearch Status
object Service "ElasticSearch Status" {
import "generic-service"
host_name = "myesnode"
check_command = "check_es_system"
vars.es_address = "myescluster.in.the.cloud"
vars.es_user = "read"
vars.es_password = "only"
vars.es_checktype = "tps"
vars.es_warn = "50,170,1000"
vars.es_crit = "100,200,5000"
}
This monitoring plugin was made for Elasticsearch, but is compatible to OpenSearch (a fork of Elasticsearch). The following compatibility matrix should provide information which checks can be executed.
| Check Type | Elasticsearch | OpenSearch * |
| status | OK | OK |
| cpu | OK | OK |
| mem | OK | OK |
| disk | OK | OK |
| readonly | OK | OK |
| jthreads | OK | OK |
| tps | OK | OK |
| master | OK | OK |
* Tested with OpenSearch 2.12.x