Last update: December 08, 2020
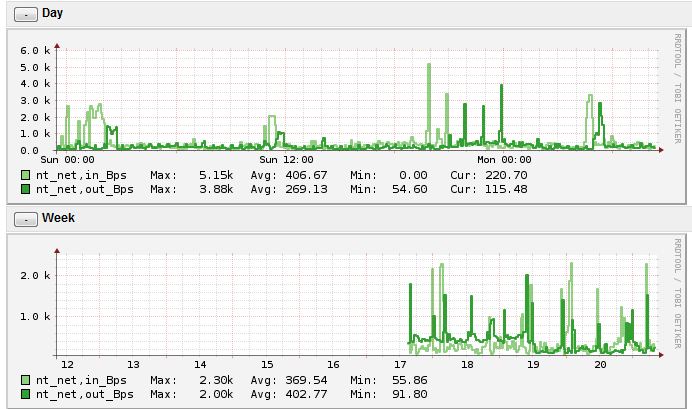
This plugin uses check_nt, which is part of the official Nagios plugin collection. However with check_nt you only get to check one value (e.g. Bytes sent/s), if one wants to create graphics with Bytes_in and Bytes_out, there is need to bundle two checks in one. This is where this plugin plays its part. It launches two check_nt checks (one for Bytes sent/s and one for Bytes received/s) and bundles both checks to one common output.
If you are looking for commercial support for this monitoring plugin, need customized modifications or in general customized monitoring plugins, contact us at Infiniroot.com.

14770 downloads so far...
Download plugin and save it in your Nagios/Monitoring plugin folder (usually /usr/lib/nagios/plugins, depends on your distribution). Afterwards adjust the permissions (usually chmod 755).
Community contributions welcome on GitHub repo.
20111116 First version released
20120126 Bugfix in port check
20121010 Bugfix in password handling
20121019 Handling Connection Error (thanks Hermit)
20151126 Verify interface parameter was set
20151127 Handling connection error on second connection, too
20151127 Fix perfdata format
20151215 Add network interface detection (-d parameter)
20190708 Handle different Windows languages (only 'de' for now)
Q: How do I find the correct name of the network interface on the Windows host?
A: You have several ways to list the network interfaces:
typeperf.exe -qx | find "Network Interface"
./check_win_net_usage.sh -H windowshost -p 12489 -d
vmxnet3 Ethernet Adapter _5
| Parameter | Description |
| -H* | Hostname of Windows server to check |
| -p | Listening port of NSClient++ on target server (default: 12489) |
| -s | Password in case NSClient++ was defined to use a password |
| -i+ | Name of network interface to use (not ethX, check Windows performance GUI) |
| -o | Choose output of value in KB, MB (default Byte) |
| -d+ | Detect network interfaces on target host |
| -l | Depending on the Windows language, the interface lookup might not work. With this parameter you can specify the language of the target Windows host. Currently only supports 'de' as value. Default is English (no input needed). |
| --help | Show help/usage |
* mandatory parameter
+ either -i for interface check or -d for interface detection is mandatory
Usage:
./check_win_net_usage.sh -H hostaddress [-p port] [-s pass] (-i netdev|-d) [o unit] [-l lang]
Example:
./check_win_net_usage.sh -H mywindows.server.local -p 12489 -i "VMware Accelerated AMD PCNet Adapter"
Network OK - 14 Bytes Received/sec, 4 Bytes Sent/sec|bytes_in=14608;bytes_out=4196
Here the command is defined with only one fixed parameter (-i), the other parameters are all handled in $ARG2$:
# check_win_net_usage - Output in Bytes/s
define command {
command_name check_win_net_usage
command_line $USER1$/check_win_net_usage.sh -H $HOSTADDRESS$ -i $ARG1$ $ARG2$
}
Another example, where the output is fixed to KB:
# check_win_net_usage - Fixed output in KBytes/s
define command {
command_name check_win_net_usage
command_line $USER1$/check_win_net_usage.sh -H $HOSTADDRESS$ -i $ARG1$ -o KB
$ARG2$
}
# check_win_net_usage definition (default output in KB)
object CheckCommand "check_win_net_usage" {
import "plugin-check-command"
command = [ PluginDir + "/check_win_net_usage.sh" ]
arguments = {
"-H" = "$win_net_usage_address$"
"-p" = "$win_net_usage_port$"
"-s" = "$win_net_usage_password$"
"-i" = "$win_net_usage_interface$"
"-o" = "$win_net_usage_output$"
"-l" = "$win_net_usage_language$"
}
vars.win_net_usage_address = "$address$"
vars.win_net_usage_port = "12489"
vars.win_net_usage_output = "KB"
}
# Check Windows Network
define service{
use generic-service
host_name windows1
service_description Network Usage
check_command check_win_net_usage!"VMware Accelerated AMD PCNet Adapter"
}
In this second example, NSClient++ is listening on port 1248. Default is 12489:
# Check Windows Network
define service{
use generic-service
host_name windows1
service_description Network Usage
check_command check_win_net_usage!"VMware Accelerated AMD PCNet Adapter"!-p 1248
}
Another example where NSClient++ requires the password 'passw' and the output should show MBytes instead of Bytes:
# Check Windows Network
define service{
use generic-service
host_name windows1
service_description Network Usage
check_command check_win_net_usage!"VMware Accelerated AMD PCNet Adapter"!-p 1248 -s passw -o MB
}
Basic example of a service object where only the unit output is different than the default:
# Check Network IO on interface 'VMware Accelerated AMD PCNet Adapter'
object Service "Network IO VMware Accelerated AMD PCNet Adapter" {
import "generic-service"
host_name = "windows1"
check_command = "check_win_net_usage"
vars.win_net_usage_interface = "VMware Accelerated AMD PCNet Adapter"
vars.win_net_usage_output = "MB"
}
The next example is more interesting as it uses apply rules (a feature of Icinga 2.x). Let's assume we have a couple of Windows hosts already defined with custom attributes:
object Host "windows1" {
import "generic-host"
address = "192.168.100.44"
vars.os = "Windows"
vars.interfaces = [ "vmxnet3 Ethernet Adapter _5" ]
}
Using these custom attributes (vars.os and vars.interfaces) we can now create an apply rule:
# Apply Rule for Windows Network IO
apply Service "Network IO " for (interface in host.vars.interfaces) {
import "generic-service"
check_command = "check_win_net_usage"
vars.win_net_usage_interface = interface
assign where host.address && host.vars.os == "Windows"
ignore where host.vars.applyignore.networkio == true
}
This "Network IO" service object will now be applied to all hosts which have the custom host attributes host.vars.os set to "Windows" and host.vars.server.interfaces is defined. As vars.interfaces is an array, you can define multiple interfaces.