
As I was building a dashboard to show live statistics from solar production (using data from a SolarEdge inverter) and power usage, I was wondering how to integrate the sun's trajectory into the panel.
In the past I've already seen a couple of such graphs which have implemented the sun.
For example Rafael's Home Assistant dashboard is using the sun's trajectory to calculate the best scenario solar production in advance:

Another nice one I remember out of my head is a very nice Grafana dashboard from Thomas:
Time to figure out myself how this can be implemented!
Well, it all starts with the "Sun and Moon" plugin, which is available for and can be directly installed into Grafana.

Note: You need administrator permissions on the Grafana instance to be able to install plugins.
Once installed, the "Sun and Moon" data is presented as an additional data source inside Grafana. By defining your exact GPS position (using latitude and longitude), the data is calculated according to your position and is now able to show you sunrise, sunset and also the trajectory. The same is also available for the moon.
The next step is to use the data from the sun's trajectory into an existing panel. I had already prepared the graph with all my relevant photovoltaic production and power usage:

So far so good, but now let's add the sun into it.
As I mentioned before, the plugin adds a new data source to Grafana. But how can the panel use multiple data sources? I did not know this before, but the (newer) panels in Grafana actually support multiple data sources, aka "Mixed Data Sources". Change the panel to use --Mixed-- as data source:

Now each query can select its own data source!
At the end of the panel's query configuration, add a new query (+ Query) and select "Sun and Moon" as data source. Select the metric "Sun altitude":

No further configurations or complex queries need to be done! Amazing!
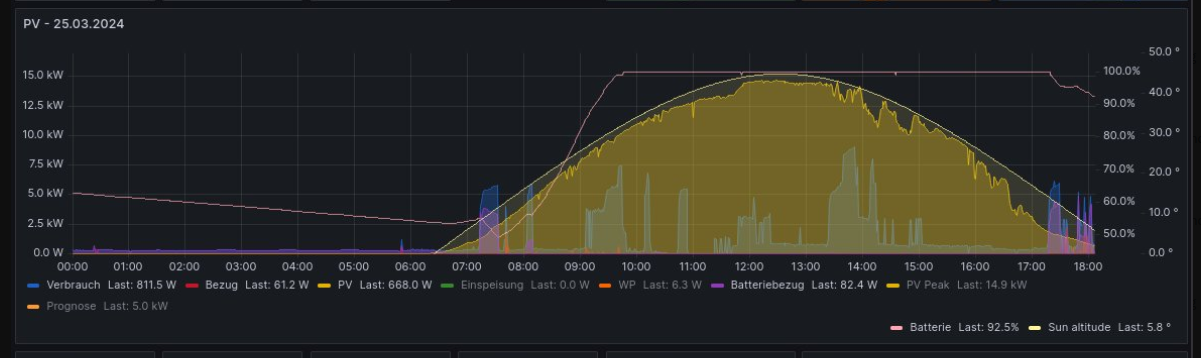
Now with the sun and moon data source added into my "Power Stats" panel (and some style overrides added), the final graph now looks like this:

The sun's trajectory can be seen in the background with the orange background and lines. On the right-hand axis the sun's position in degrees is presented as well.
Zooming out a bit (= larger time range) shows the solar production increases in parallel to the sun's trajectory - at least in the morning as my photovoltaic panels are located towards South.

That's pretty awesome for a monitoring dude like me!
No comments yet.

AWS Android Ansible Apache Apple Atlassian BSD Backup Bash Bluecoat CMS Chef Cloud Coding Consul Containers CouchDB DB DNS Database Databases Docker ELK Elasticsearch Filebeat FreeBSD Galera Git GlusterFS Grafana Graphics HAProxy HTML Hacks Hardware Icinga Icingaweb Icingaweb2 Influx Internet Java KVM Kibana Kodi Kubernetes LVM LXC Linux Logstash Mac Macintosh Mail MariaDB Minio MongoDB Monitoring Multimedia MySQL NFS Nagios Network Nginx OSSEC OTRS Office PGSQL PHP Perl Personal PostgreSQL Postgres PowerDNS Proxmox Proxy Python Rancher Rant Redis Roundcube SSL Samba Seafile Security Shell SmartOS Solaris Surveillance Systemd TLS Tomcat Ubuntu Unix VMWare VMware Varnish Virtualization Windows Wireless Wordpress Wyse ZFS Zoneminder