
This weekend I had a disk failure in a server. Problem: The disk was only partially failing.
If the disk would have been completely defect, raid would have just disabled the disk and everything continued on the second disk. But both SMART and mdraid thought the disk was still OK. Therefore, as soon as the first disk problems hit the system, mdraid always tried to resynchronize the disks, causing enormous load (up to 100!) whenever a bad sector was hit. This made the server completely useless.
After some research I found the following entries in kernel.log which clearly indicated a problem on the first disk:
Nov 2 21:59:06 server kernel: [7087493.950091] ata1.00: exception Emask 0x0 SAct 0xf SErr 0x0 action 0x6 frozen
Nov 2 21:59:06 server kernel: [7087493.950141] ata1.00: failed command: WRITE FPDMA QUEUED
Nov 2 21:59:06 server kernel: [7087493.950173] ata1.00: cmd 61/08:00:a8:5b:94/00:00:36:00:00/40 tag 0 ncq 4096 out
Nov 2 21:59:06 server kernel: [7087493.950174] res 40/00:00:00:00:00/00:00:00:00:00/a0 Emask 0x4 (timeout)
Nov 2 21:59:06 server kernel: [7087493.950260] ata1.00: status: { DRDY }
Nov 2 21:59:06 server kernel: [7087493.950283] ata1.00: failed command: WRITE FPDMA QUEUED
Nov 2 21:59:06 server kernel: [7087493.950313] ata1.00: cmd 61/08:08:30:47:4a/00:00:04:00:00/40 tag 1 ncq 4096 out
Nov 2 21:59:06 server kernel: [7087493.950315] res 40/00:00:00:00:00/00:00:00:00:00/00 Emask 0x4 (timeout)
Nov 2 21:59:06 server kernel: [7087493.950400] ata1.00: status: { DRDY }
Nov 2 21:59:06 server kernel: [7087493.950423] ata1.00: failed command: WRITE FPDMA QUEUED
Nov 2 21:59:07 server kernel: [7087493.950453] ata1.00: cmd 61/08:10:b0:5b:94/00:00:36:00:00/40 tag 2 ncq 4096 out
Nov 2 21:59:07 server kernel: [7087493.950455] res 40/00:00:00:00:00/00:00:00:00:00/00 Emask 0x4 (timeout)
Nov 2 21:59:07 server kernel: [7087493.950540] ata1.00: status: { DRDY }
Nov 2 21:59:07 server kernel: [7087493.950564] ata1.00: failed command: WRITE FPDMA QUEUED
Nov 2 21:59:07 server kernel: [7087493.950593] ata1.00: cmd 61/08:18:a0:a7:f9/00:00:35:00:00/40 tag 3 ncq 4096 out
Nov 2 21:59:07 server kernel: [7087493.950595] res 40/00:00:40:25:10/00:04:36:00:00/00 Emask 0x4 (timeout)
Nov 2 21:59:07 server kernel: [7087493.950680] ata1.00: status: { DRDY }
Nov 2 21:59:07 server kernel: [7087493.950709] ata1: hard resetting link
Nov 2 21:59:07 server kernel: [7087494.493817] ata1: SATA link up 1.5 Gbps (SStatus 113 SControl 310)
Nov 2 21:59:07 server kernel: [7087494.960980] ata1.00: configured for UDMA/133
Nov 2 21:59:07 server kernel: [7087494.961009] ata1.00: device reported invalid CHS sector 0
Nov 2 21:59:07 server kernel: [7087494.961036] ata1.00: device reported invalid CHS sector 0
Nov 2 21:59:07 server kernel: [7087494.961063] ata1.00: device reported invalid CHS sector 0
Nov 2 21:59:07 server kernel: [7087494.961097] ata1: EH complete
Nov 2 23:44:04 server kernel: [7093789.503985] INFO: task jbd2/dm-2-8:970 blocked for more than 120 seconds.
Nov 2 23:44:04 server kernel: [7093789.504018] "echo 0 > /proc/sys/kernel/hung_task_timeout_secs" disables this message.
Nov 2 23:44:04 server kernel: [7093789.504063] jbd2/dm-2-8 D 0000000000000002 0 970 2 0x00000000
Nov 2 23:44:04 server kernel: [7093789.504097] ffff88043b3df810 0000000000000046 000000039d742300 ffff880439ec4f10
Nov 2 23:44:04 server kernel: [7093789.504145] ffff88043adb6900 0000000000000000 000000000000f9e0 ffff88043a4c9fd8
Nov 2 23:44:04 server kernel: [7093789.504193] 0000000000015780 0000000000015780 ffff88043b3dcdb0 ffff88043b3dd0a8
Nov 2 23:44:04 server kernel: [7093789.504240] Call Trace:
Nov 2 23:44:04 server kernel: [7093789.504273] [
Nov 2 23:44:04 server kernel: [7093789.504308] [
Nov 2 23:44:04 server kernel: [7093789.504337] [
Nov 2 23:44:04 server kernel: [7093789.504366] [
Nov 2 23:44:04 server kernel: [7093789.504394] [
Nov 2 23:44:04 server kernel: [7093789.504422] [
Nov 2 23:44:04 server kernel: [7093789.504450] [
Nov 2 23:44:04 server kernel: [7093789.504478] [
Nov 2 23:44:04 server kernel: [7093789.504509] [
Nov 2 23:44:04 server kernel: [7093789.504541] [
Nov 2 23:44:04 server kernel: [7093789.504591] [
Nov 2 23:44:04 server kernel: [7093789.504620] [
Nov 2 23:44:04 server kernel: [7093789.504652] [
Nov 2 23:44:04 server kernel: [7093789.504681] [
Nov 2 23:44:04 server kernel: [7093789.504709] [
Nov 2 23:44:04 server kernel: [7093789.504735] [
Nov 2 23:44:04 server kernel: [7093789.504762] [
From then on, the entries with "INFO: task XYZ blocked for more than 120 seconds" were added hundreds of times in the log.
At the same time I also checked the SMART status of the affected disk ata1.00 (that's SDA). But no problems were found. But I knew that in the past I've already received SMART errors on exactly that disk which disappeared by themselves after some time (?? WTF ??).
As soon as I took /dev/sda out of the raid, the system went back to normal and was usable again. After replacement of the disk, the raid synchronization started up and after that the system ran smooth again.
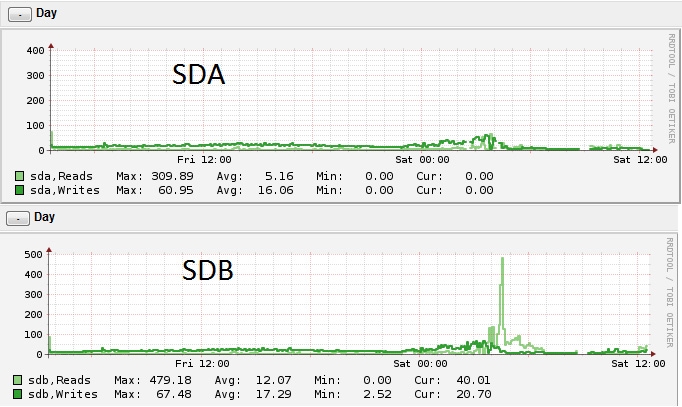
Another hint of such a disk error is when one compares the disk IO of all disks in the same raid. The following graph clearly shows that the IO is different (it should have exactly the same graph on both disks):
Today's lesson: Don't rely only on SMART or raid status to determine if a disk has a failure.
Tim from Edmonton wrote on Nov 4th, 2012:
Huh, thanks for the info. If nothing else, it reminds me to change the monitoring mode in check_mk to monitor each drive individually instead of taking an overall IO summary.

AWS Android Ansible Apache Apple Atlassian BSD Backup Bash Bluecoat CMS Chef Cloud Coding Consul Containers CouchDB DB DNS Databases Docker ELK Elasticsearch Filebeat FreeBSD Galera Git GlusterFS Grafana Graphics HAProxy HTML Hacks Hardware Icinga Influx Internet Java KVM Kibana Kodi Kubernetes LVM LXC Linux Logstash Mac Macintosh Mail MariaDB Minio MongoDB Monitoring Multimedia MySQL NFS Nagios Network Nginx OSSEC OTRS Observability Office OpenSearch PHP Perl Personal PostgreSQL PowerDNS Proxmox Proxy Python Rancher Rant Redis Roundcube SSL Samba Seafile Security Shell SmartOS Solaris Surveillance Systemd TLS Tomcat Ubuntu Unix VMware Varnish Virtualization Windows Wireless Wordpress Wyse ZFS Znuny Zoneminder