
In the past days I've been working and improving a personal Grafana dashboard showing power production from a SolarEdge inverter and power usage of my home. It's still too early to publish an article on the final solution, in case you're wondering. So right now I'm still verifying data and fixing things - just like this case.
This morning I noticed a sharp spike in one of the graphs:
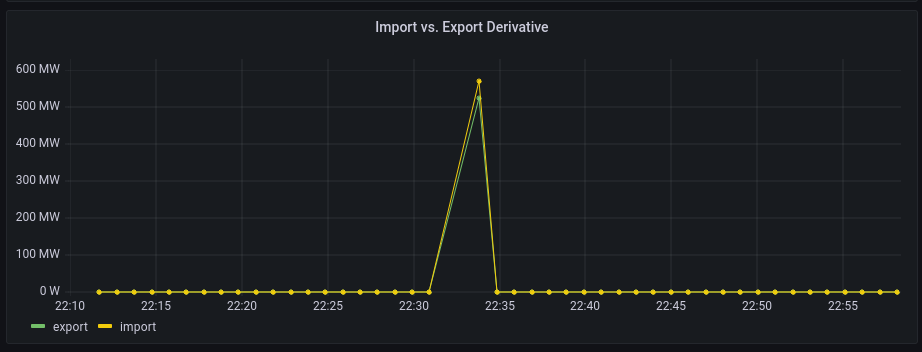
This graph represents the data from the Import and Export counter (from the SolarEdge Meter). Why would both import and export values explode in the night and use such an enormous amount of electricity (over 500 Mega Watt!)? This can't be right and something must be wrong. Let's find out!
All data is stored in InfluxDB, a time series database. I'm still using InfluxDB v1.8 with InfluxQL as I just can't wrap my head around the newer Flux queries in InfluxDB v2.
Connected with influx command to the database and used a SELECT query to retrieve all values from the import counter between a certain time range:
> SELECT import_energy_active FROM meter WHERE time > '2024-05-03T20:25:00Z' AND time < '2024-05-03T20:40:00Z';
name: meter
time import_energy_active
---- --------------------
1714767952000000000 9503501
1714768013000000000 9503503
1714768073000000000 9503508
1714768134000000000 9503517
1714768195000000000 9503531
1714768255000000000 9503541
1714768370000000000 0
1714768431000000000 9503579
1714768492000000000 9503586
1714768552000000000 9503592
1714768613000000000 9503599
1714768674000000000 9503606
1714768735000000000 9503613
1714768795000000000 9503618
Note: My local timezone in Switzerland is (currently) CEST, which is +2 from UTC, hence the range from 20:25 to 20:40 UTC.
Oh! There's a zero as value!
Let's show the date in a more human readable way:
> precision rfc3339
> SELECT import_energy_active FROM meter WHERE time > '2024-05-03T20:25:00Z' AND time < '2024-05-03T20:40:00Z';
name: meter
time import_energy_active
---- --------------------
2024-05-03T20:25:52Z 9503501
2024-05-03T20:26:53Z 9503503
2024-05-03T20:27:53Z 9503508
2024-05-03T20:28:54Z 9503517
2024-05-03T20:29:55Z 9503531
2024-05-03T20:30:55Z 9503541
2024-05-03T20:32:50Z 0
2024-05-03T20:33:51Z 9503579
2024-05-03T20:34:52Z 9503586
2024-05-03T20:35:52Z 9503592
2024-05-03T20:36:53Z 9503599
2024-05-03T20:37:54Z 9503606
2024-05-03T20:38:55Z 9503613
2024-05-03T20:39:55Z 9503618
The graph is therefore right, technically speaking. As the graph is showing derivative values (differential values between two data points), the jump from the value 0 at 20:32:50Z to 9503579 at 20:33:51Z is massive - but wrong.
The question is: How did this zero get into the measurement? Did the SolarEdge meter give off this wrong value? Was there a connectivity issue between the Python script and the SolarEdge inverter (ModBus listener)?
It turns out that the Python script had died and the process was automatically restarted by the Systemd service:
root@monitoring:~# systemctl status solaredge
- solaredge.service - SolarEdge collector and write into InfluxDB
Loaded: loaded (/etc/systemd/system/solaredge.service; enabled; vendor preset: enabled)
Active: active (running) since Fri 2024-05-03 22:32:50 CEST; 7h ago
Main PID: 16515 (python3)
CPU: 8.622s
CGroup: /system.slice/solaredge.service
|-16515 python3 /home/ck/solaredge_modbus/modified_influxdb.py --interval 60 --influx_host localhost --influx_db solaredge xx.xx.xx.xx 1502
May 03 22:32:49 monitoring systemd[1]: Starting SolarEdge collector and write into InfluxDB...
May 03 22:32:50 monitoring systemd[1]: Started SolarEdge collector and write into InfluxDB.
The erroneous zero therefore was inserted when the Python collector script was restarted. If this reproduces I will have to investigate the Python script further but for now let's focus on fixing the graph.
To fix the problematic spike in the graph, there are two solutions:
Let's focus on the Grafana part.
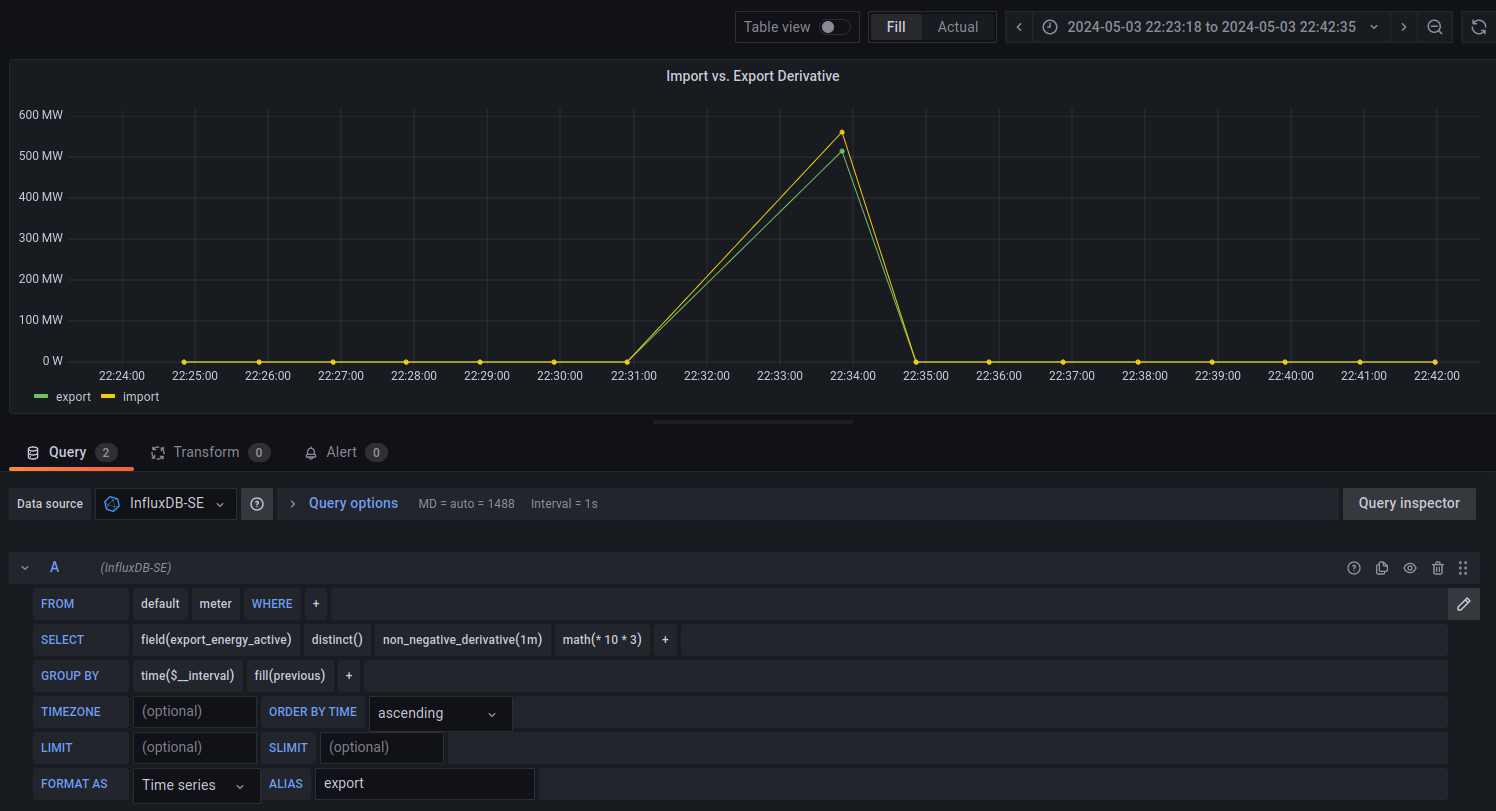
The visualization (previously known as panel in Grafana) uses an InfluxQL query to retrieve the data from the data source, similar to what I used above with the influx command.
The query can be adjusted with an additional WHERE condition to only select values larger than 0:
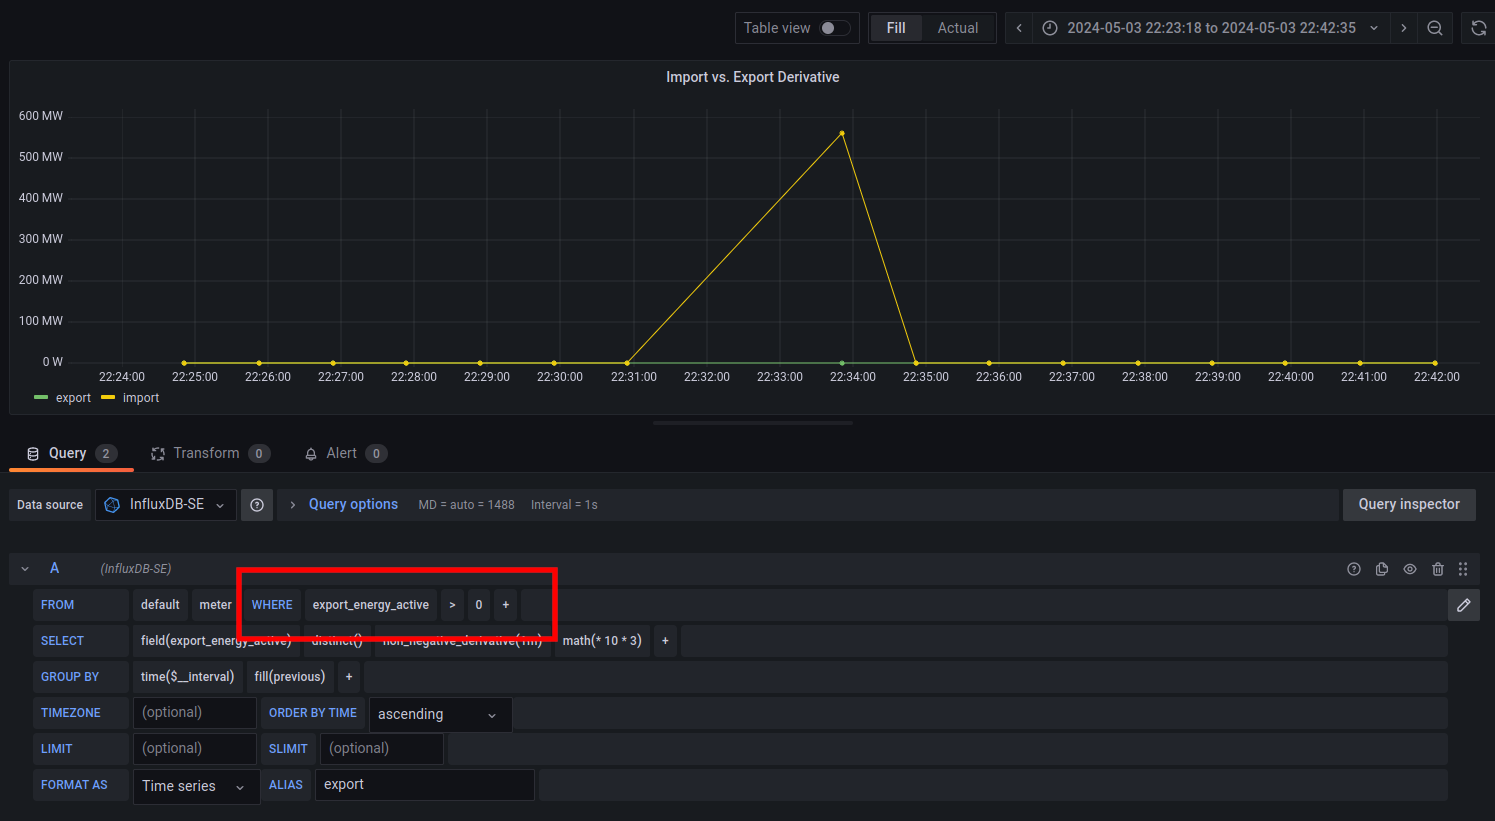
Noticed the green line (export) is now horizontal (at least compared to the yellow import line) and does not have a spike anymore?
After also adjusting the second query (import), the graph now looks much more realistic and makes sense again:
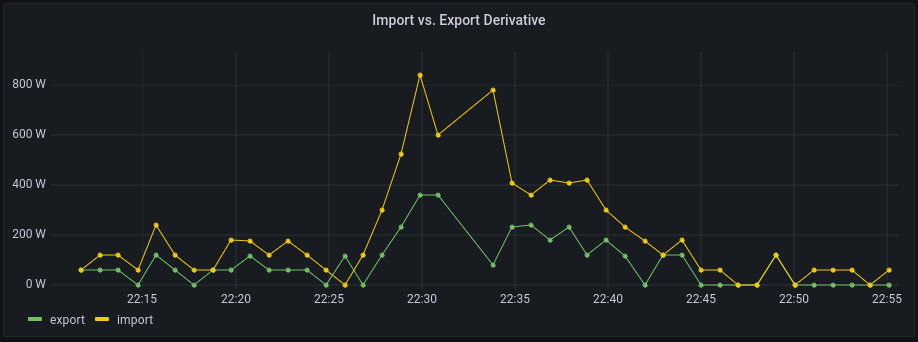
This solution (adjusting the visualization's query) seems to be better (and should be "resistant" to wrong data inserted by the Python script) than to manually delete the wrong data.

AWS Android Ansible Apache Apple Atlassian BSD Backup Bash Bluecoat CMS Chef Cloud Coding Consul Containers CouchDB DB DNS Database Databases Docker ELK Elasticsearch Filebeat FreeBSD Galera Git GlusterFS Grafana Graphics HAProxy HTML Hacks Hardware Icinga Icingaweb Icingaweb2 Influx Internet Java KVM Kibana Kodi Kubernetes LVM LXC Linux Logstash Mac Macintosh Mail MariaDB Minio MongoDB Monitoring Multimedia MySQL NFS Nagios Network Nginx OSSEC OTRS Office PGSQL PHP Perl Personal PostgreSQL Postgres PowerDNS Proxmox Proxy Python Rancher Rant Redis Roundcube SSL Samba Seafile Security Shell SmartOS Solaris Surveillance Systemd TLS Tomcat Ubuntu Unix VMWare VMware Varnish Virtualization Windows Wireless Wordpress Wyse ZFS Zoneminder