
Sometimes a check is configured in Icinga 2 but for some reason the output differs from the check run on the command line. In such a situation it may help to use advanced debug tools, such as Icinga 2's console.
When a monitoring plugin (check_netapp_ontap) was executed on the command line to check for the current usage of a NetApp volume, the plugin executed fine and nicely displayed the volume's current disk usage:
# /usr/lib/nagios/plugins/check_netapp_ontap.pl -H netapp -u "user" -p "pass" -o volume_health -m include,cifsserver/v_media_share1
OK - No problem found (1 checked) | 'cifsserver/v_media_share1_usage'=160400691200B;;;0;255013683200
However when the check was added in Icinga 2, the performance data showed something completely different in the Icingaweb user interface:
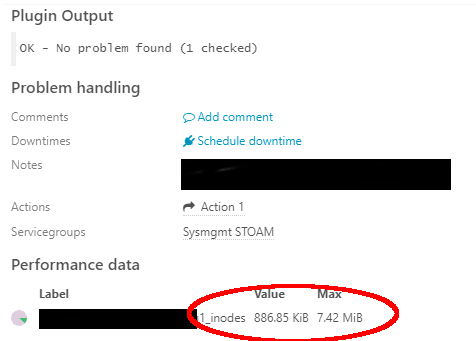
Instead of the expected "_usage", the performance data showed "_inodes". Where is this coming from?
To look into more details of this particular check, the Icinga 2 console is a very helpful tool. The console uses the Icinga 2 API in the background. This of course requires, that the API feature is enabled and a user with the relevant credentials exist. Check if /etc/icinga2/features-enabled/api.conf exists, if not enable the API:
# icinga2 feature enable api
Then make sure you have valid API users configured. The default is set in /etc/icinga2/conf.d/api-users.conf. A "root" user usually already exists. If not, create one like this:
object ApiUser "root" {
password = "secret"
// client_cn = ""
permissions = [ "*" ]
}
Now the console can be connected to the local Icinga 2 API, using the credentials from above
# icinga2 console --connect 'https://root:secret@localhost:5665/'
By using the console, the specific check (service) can be retrieved using the get_service() function:
<1> => get_service("netapp", "Volume v_media_share1")
{
__name = "netapp!Volume v_media_share1"
acknowledgement = 0.000000
acknowledgement_expiry = 0.000000
active = true
check_attempt = 1.000000
check_command = "check_netapp_ontap"
check_interval = 7200.000000
check_period = "24x7"
check_timeout = null
command_endpoint = ""
display_name = "Volume v_media_share1"
downtime_depth = 0.000000
[...]
The output can be pretty big. In this particular situation we want to find out what exactly happened at the last check execution. This part can be found further down, inside the nested last_check_result:
last_check_result = {
active = true
check_source = "inf-monm02-p"
command = [ "/usr/lib/nagios/plugins/check_netapp_ontap.pl", "-H", "netapp", "-c", "95", "-m", "include,cifsserver/v_media_share1", "-o", "volume_health", "-p", "pass", "-u", "user", "-w", "80" ]
execution_end = 1607095462.990065
execution_start = 1607095458.837354
exit_status = 0.000000
output = "OK - No problem found (1 checked) "
performance_data = [ "cifsserver/v_media_share1_inodes=908161B;;;0;7782389" ]
schedule_end = 1607095462.990105
schedule_start = 1607095458.000000
state = 0.000000
ttl = 0.000000
type = "CheckResult"
vars_after = {
attempt = 1.000000
reachable = true
state = 0.000000
state_type = 1.000000
}
vars_before = {
attempt = 1.000000
reachable = true
state = 0.000000
state_type = 1.000000
}
}
Thanks to this, we now know the exact command (including all parameters) which was executed on the monitoring server "inf-monm02-p" (see check_source). The check results are also shown, split into the output and performance_data fields. And yes, the performance_data clearly shows the inodes performance data - the same as the Icingaweb interface shows.
Thanks to the console output, we now know that thresholds were added. The exact same command can now be launched on the same server to see whether the output differs:
$ /usr/lib/nagios/plugins/check_netapp_ontap.pl -H "netapp" -c "95" -m "include,cifsserver/v_media_share1" -o "volume_health" -p "pass" -u "user" -w "80"
OK - No problem found (1 checked) | 'cifsserver/v_media_share1_inodes'=908187B;;;0;7782389
And indeed, now only inodes show up in the performance data!
Taking a closer look at the threshold documentation of this plugin reveals:
volume_health
desc: Check the space and inode health of a vServer volume. If space % and space in *B are both defined the smaller value of the two will be used when deciding if the volume is in a warning or critical state. This allows you to better accomodate large volume monitoring.
thresh: Space % used, space in *B (i.e MB) remaining, inode count remaining, inode % used (Usage example: 80%i), "offline" keyword.
node: The node option restricts this check by vserver name.
Interpreting this means that for space/usage thresholds either the percentage sign % or (G|M)B must follow. Otherwise the check will only check for inodes. By adding the percentage sign to the thresholds now finally shows the correct volume usage:
$ /usr/lib/nagios/plugins/check_netapp_ontap.pl
-H "netapp" -c "95%" -m "include,cifsserver/v_media_share1" -o
"volume_health" -p "pass" -u "user" -w "80%"
OK - No problem found (1 checked) | 'cifsserver/v_media_share1_usage'=160409325568B;;;0;255013683200
Once the thresholds were adjusted in the Service object, the usage performance data also appeared in Icingaweb user interface.
No comments yet.

AI AWS Android Ansible Apache Apple Atlassian BSD Backup Bash Bluecoat CMS Chef Cloud Coding Consul Containers CouchDB DB DNS Databases Docker ELK Elasticsearch Filebeat FreeBSD Galera Git GlusterFS Grafana Graphics HAProxy HTML Hacks Hardware Icinga Influx Internet Java KVM Kibana Kodi Kubernetes LVM LXC Linux Logstash Mac Macintosh Mail MariaDB Minio MongoDB Monitoring Multimedia MySQL NFS Nagios Network Nginx OSSEC OTRS Observability Office OpenSearch PHP Perl Personal PostgreSQL PowerDNS Proxmox Proxy Python Rancher Rant Redis Roundcube SSL Samba Seafile Security Shell SmartOS Solaris Surveillance Systemd TLS Tomcat Ubuntu Unix VMware Varnish Virtualization Windows Wireless Wordpress Wyse ZFS Znuny Zoneminder