
When using an ELK stack (Elasticsearch, Logstash, Kibana) for central logging, the great advantage is that all the logs from all kinds of systems come together into the same system. Logs can be aggregated and compared - matching the same timestamp. This allows to find issues across multiple systems and platforms.
There is a problem however: These logs can be huge! When using hundreds of servers with dozens of users and applications, each creating logs, one better has a few terabytes of disk capacity available. Not only will a lot of logs use a lot of disk capacity, Elasticsearch will also use a lot of CPU and memory resources, as the data is constantly being indexed. And of course there are dashboards and searches in Kibana which, again, use Elasticsearch in the background.
If you have infinite resources, you can easily horizontally scale. Meaning: Adding more Elasticsearch nodes or increase the capacities of these nodes. But this is costly and sometimes (actually always) it's better to "clean up" first, before moving new furniture in.
There are two major possibilities how data in Elasticsearch can be cleaned up:
1) Define a data retention: Not all data needs to be held forever. Some application data may be of use for a couple of days but is then not relevant anymore. Such data can be removed with a lifecycle policy.
2) Prevent irrelevant data from being indexed by Elasticsearch. Some logs may be completely irrelevant to be analyzed. So these events can be prevented from arriving in Elasticsearch.
In this article we will focus on the second possibility: How to prevent irrelevant data from being indexed by Elasticsearch. The first possibility (Lifecycle policies) will be described in a future article.
VMware ESXi servers are a great example. Even though each ESXi server has some (limited) syslog configuration options, the logging severity cannot be adjusted:
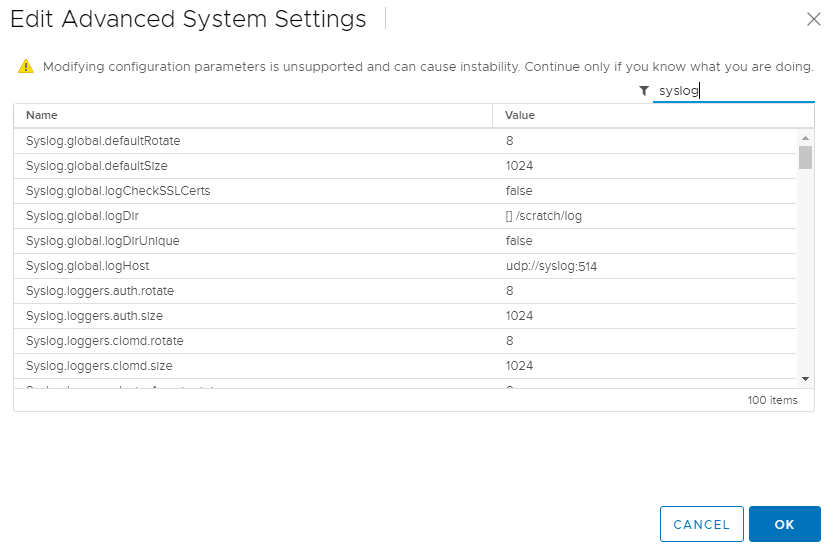
Note: Even by following several workarounds and official articles, it was not possible to define a lower severity than debug.
This means that syslog logs sent from ESXi servers are using the following severities:
And because the ESXi servers are very talkative, they create a lot of logs. Here is a visualization of the log behavior of some ESXi servers:
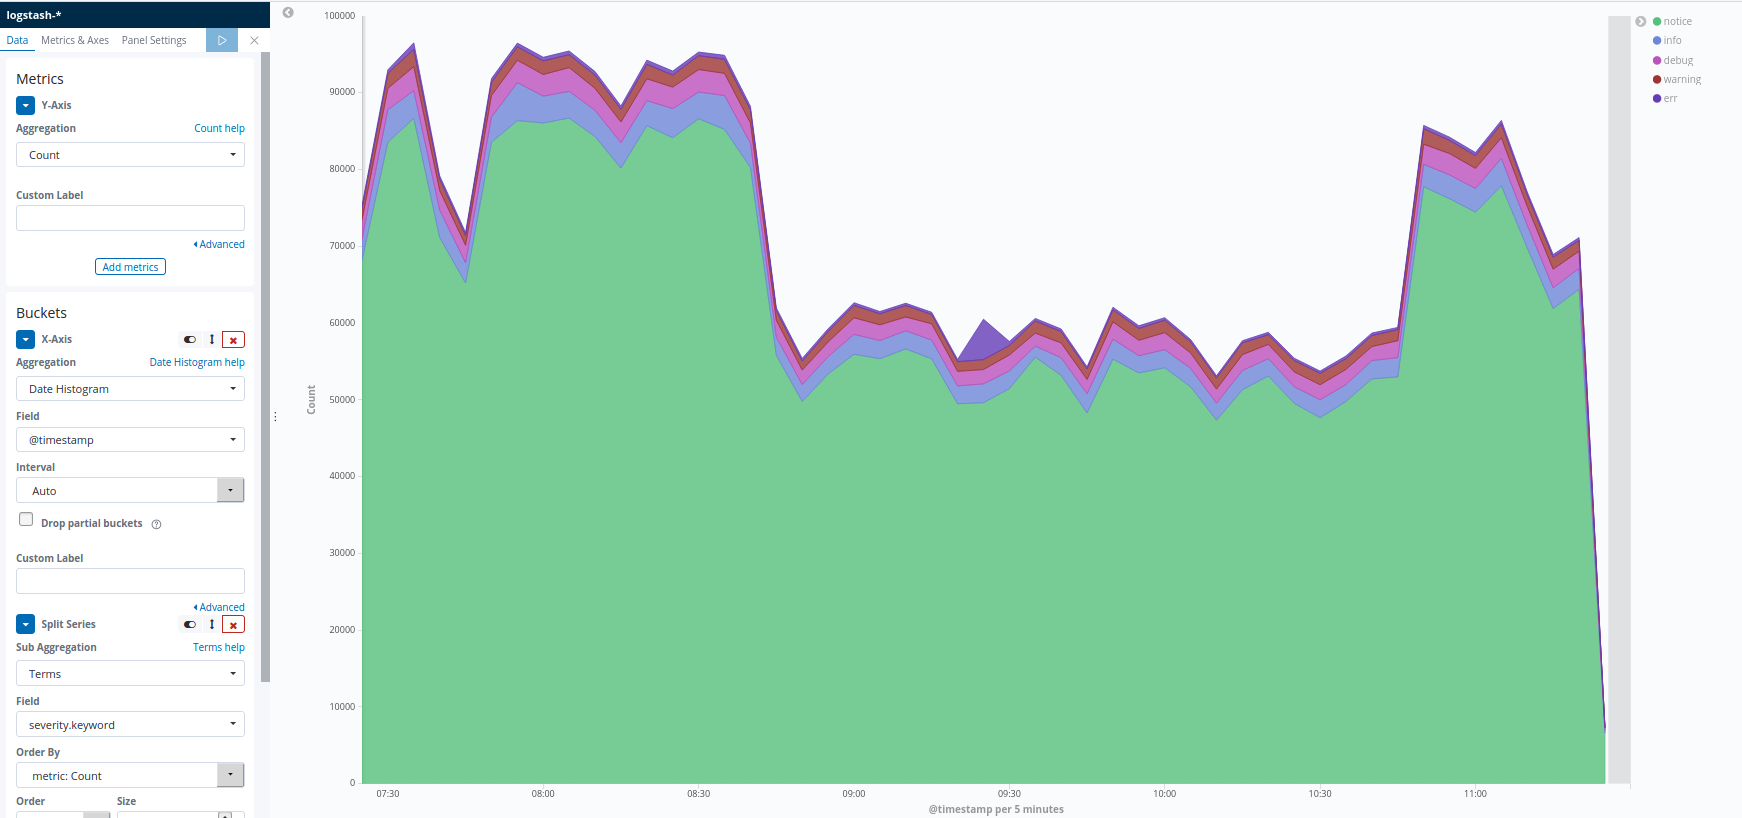
As one can see clearly, the logs with severity "notice" are by far the most frequent ones. Another visualization, using a pie chart, makes it even more clear:
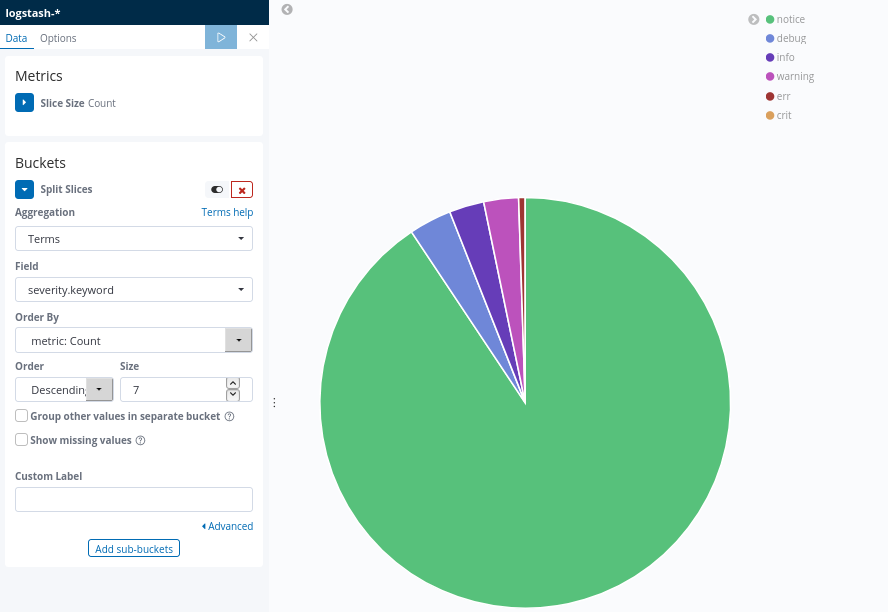
More than 90% of all ESXi logs are using the notice severity. Logs which are not useful in our case.
We decided to keep logs with the severities "warning", "err" and "crit" to be able to research problems in the ELK stack. But as the severity cannot be changed in vSphere, we need to find another way to prevent the other severities from being indexed in Elasticsearch.
As we are using Logstash on all central syslogs (before forwarding to Elasticsearch), we can apply filters to the incoming messages. In general we already do this to define specific indexes, depending on the type of application log arriving. But a filter can also be used to drop events/log messages, by using the drop filter.
The following filter was created on the Logstash instance handling the ESXi logs:
root@logstash:~# cat /etc/logstash/conf.d/15-filter-esxi.conf
filter {
if "inf-esx" in [sysloghost] and [severity] not in ["warning", "err", "crit"] {
drop { }
}
}
There are multiple conditions which must match that the log events are dropped:
1: The value of the field [sysloghost] must match "inf-esx". Obviously all ESXi servers in our setup have this value as hostname.
2: The second condition is a reversed condition. The field [severity] should not be one of the following: "warning", "err" or "crit". This means that log events with a severity of either "debug", "notice" or "info" will be dropped.
The second condition could of course also be written differently, especially looking for the severities to be dropped.
After applying this new filter and restarting Logstash, it took a couple of moments and then the number of indexed ESXi logs dropped significantly:
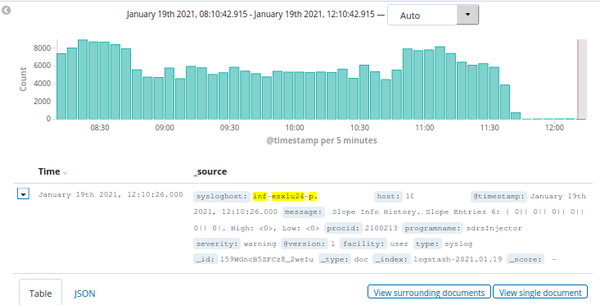
A quick check verified it: Only logs with the wanted severities are now indexed in Elasticsearch.
No comments yet.

AI AWS Android Ansible Apache Apple Atlassian BSD Backup Bash Bluecoat CMS Chef Cloud Coding Consul Containers CouchDB DB DNS Databases Docker ELK Elasticsearch Filebeat FreeBSD Galera Git GlusterFS Grafana Graphics HAProxy HTML Hacks Hardware Icinga Influx Internet Java KVM Kibana Kodi Kubernetes LVM LXC Linux Logstash Mac Macintosh Mail MariaDB Minio MongoDB Monitoring Multimedia MySQL NFS Nagios Network Nginx OSSEC OTRS Observability Office OpenSearch PHP Perl Personal PostgreSQL PowerDNS Proxmox Proxy Python Rancher Rant Redis Roundcube SSL Samba Seafile Security Shell SmartOS Solaris Surveillance Systemd TLS Tomcat Ubuntu Unix VMware Varnish Virtualization Windows Wireless Wordpress Wyse ZFS Znuny Zoneminder