
The monitoring plugin check_nwc_health, developed and maintained by Gerhard Lausser from Consol Labs, allows different kind of thresholds. But why? And how to use them? Sometimes it's difficult to find some real life or even documentation examples for these threshold parameters.
This article explains the difference between the --warning / --critical and --warningx / --criticalx parameters and how to integrate this into Icinga 2.
Not all thresholds can be hard-coded. If you use the plugin with --mode interface-health on a network switch, a lot of data will be analyzed by the plugin. Some are percentage related (such as usage in/usage out), others are value based (discards):
nagios@icinga:~$ /usr/lib/nagios/plugins/check_nwc_health --hostname switch --community public --mode interface-health --name TwentyFiveGigE1/0/8
CRITICAL - interface TwentyFiveGigE1/0/8 (alias TEL-G4-NETSW012-PO108) discards in:0.00/s out:10.08/s , TwentyFiveGigE1/0/8 (alias TEL-G4-NETSW012-PO108) is up/up, interface TwentyFiveGigE1/0/8 (alias TEL-G4-NETSW012-PO108) usage is in:0.11% (1068880.00bit/s) out:15.11% (151052893.54bit/s), interface TwentyFiveGigE1/0/8 (alias TEL-G4-NETSW012-PO108) errors in:0.00/s out:0.00/s , interface TwentyFiveGigE1/0/8 (alias TEL-G4-NETSW012-PO108) broadcast in:0.16% out:0.00% | 'TwentyFiveGigE1/0/8_usage_in'=0.11%;80;90;0;100 'TwentyFiveGigE1/0/8_usage_out'=15.11%;80;90;0;100 'TwentyFiveGigE1/0/8_traffic_in'=1068880;800000000;900000000;0;1000000000 'TwentyFiveGigE1/0/8_traffic_out'=151052893.54;800000000;900000000;0;1000000000 'TwentyFiveGigE1/0/8_errors_in'=0;1;10;; 'TwentyFiveGigE1/0/8_errors_out'=0;1;10;; 'TwentyFiveGigE1/0/8_discards_in'=0;1;10;; 'TwentyFiveGigE1/0/8_discards_out'=10.08;1;10;; 'TwentyFiveGigE1/0/8_broadcast_in'=0.16%;10;20;0;100 'TwentyFiveGigE1/0/8_broadcast_out'=0.00%;10;20;0;100
So setting thresholds based on percentage (for example using --warning 90 and --critical 95) does not work:
nagios@icinga:~$ /usr/lib/nagios/plugins/check_nwc_health --hostname switch --community public --mode interface-health --name TwentyFiveGigE1/0/8 --warning 90 --critical 95
OK - TwentyFiveGigE1/0/8 (alias TEL-G4-NETSW012-PO108) is up/up, interface TwentyFiveGigE1/0/8 (alias TEL-G4-NETSW012-PO108) usage is in:0.20% (2002346.86bit/s) out:0.70% (7029280.57bit/s), interface TwentyFiveGigE1/0/8 (alias TEL-G4-NETSW012-PO108) errors in:0.00/s out:0.00/s , interface TwentyFiveGigE1/0/8 (alias TEL-G4-NETSW012-PO108) discards in:0.00/s out:0.14/s , interface TwentyFiveGigE1/0/8 (alias TEL-G4-NETSW012-PO108) broadcast in:0.25% out:0.01% | 'TwentyFiveGigE1/0/8_usage_in'=0.20%;90;95;0;100 'TwentyFiveGigE1/0/8_usage_out'=0.70%;90;95;0;100 'TwentyFiveGigE1/0/8_traffic_in'=2002346.86;90;95;0;1000000000 'TwentyFiveGigE1/0/8_traffic_out'=7029280.57;90;95;0;1000000000 'TwentyFiveGigE1/0/8_errors_in'=0;90;95;; 'TwentyFiveGigE1/0/8_errors_out'=0;90;95;; 'TwentyFiveGigE1/0/8_discards_in'=0;90;95;; 'TwentyFiveGigE1/0/8_discards_out'=0.14;90;95;; 'TwentyFiveGigE1/0/8_broadcast_in'=0.25%;90;95;0;100 'TwentyFiveGigE1/0/8_broadcast_out'=0.01%;90;95;0;100
This can be nicely seen in a comparison of the performance data:
'TwentyFiveGigE1/0/8_usage_in'=0.20%;90;95;0;100
'TwentyFiveGigE1/0/8_discards_out'=0.14;90;95;;
Additionally to the different types of values returned there is also the fact that you cannot compare apples with pears. Let's assume all the returned data is a percentage type. Setting a warning threshold at 90% and a critical threshold at 95% would basically work, but the outcome is totally different. A warning at 90% makes sense in terms of interface usage but if you have 90% error rate on the interface, that warning is way too high (you do not want any errors!).
If you use however a specific check mode where you know the returned data is a percentage (--mode interface-usage), you can of course use the percentage thresholds:
nagios@icinga:~$ /usr/lib/nagios/plugins/check_nwc_health --hostname switch --community public --mode interface-usage --name TwentyFiveGigE1/0/8 --warning 90 --critical 95
OK - interface TwentyFiveGigE1/0/8 (alias TEL-G4-NETSW012-PO108) usage is in:0.15% (1522678.95bit/s) out:0.31% (3143326.95bit/s) | 'TwentyFiveGigE1/0/8_usage_in'=0.15%;90;95;0;100 'TwentyFiveGigE1/0/8_usage_out'=0.31%;90;95;0;100 'TwentyFiveGigE1/0/8_traffic_in'=1522678.95;90;95;0;1000000000 'TwentyFiveGigE1/0/8_traffic_out'=3143326.95;90;95;0;1000000000
Note that the performance data still contains non-percentage data (traffic_in and traffic_out).
To cope with that situation, the --warningx and --criticalx parameters exist. They allow a finer tuning of thresholds, using a regular expression match.
In the following example, the interface's broadcast thresholds are set to 101 (percent), basically ignoring all broadcast alerts:
nagios@icinga:~$ /usr/lib/nagios/plugins/check_nwc_health --hostname switch --community public --mode interface-usage --name TwentyFiveGigE1/0/8 --warningx 'broadcast.*=101'
OK - TwentyFiveGigE1/0/8 (alias TEL-G4-NETSW012-PO108) is up/up, interface TwentyFiveGigE1/0/8 (alias TEL-G4-NETSW012-PO108) usage is in:0.08% (793860.35bit/s) out:0.42% (4248990.26bit/s), interface TwentyFiveGigE1/0/8 (alias TEL-G4-NETSW012-PO108) errors in:0.00/s out:0.00/s , interface TwentyFiveGigE1/0/8 (alias TEL-G4-NETSW012-PO108) discards in:0.00/s out:0.00/s , interface TwentyFiveGigE1/0/8 (alias TEL-G4-NETSW012-PO108) broadcast in:0.41% out:0.02% | 'TwentyFiveGigE1/0/8_usage_in'=0.08%;80;90;0;100 'TwentyFiveGigE1/0/8_usage_out'=0.42%;80;90;0;100 'TwentyFiveGigE1/0/8_traffic_in'=793860.35;800000000;900000000;0;1000000000 'TwentyFiveGigE1/0/8_traffic_out'=4248990.26;800000000;900000000;0;1000000000 'TwentyFiveGigE1/0/8_errors_in'=0;1;10;; 'TwentyFiveGigE1/0/8_errors_out'=0;1;10;; 'TwentyFiveGigE1/0/8_discards_in'=0;1;10;; 'TwentyFiveGigE1/0/8_discards_out'=0;1;10;; 'TwentyFiveGigE1/0/8_broadcast_in'=0.41%;101;20;0;100 'TwentyFiveGigE1/0/8_broadcast_out'=0.02%;101;20;0;100
The regular expression "broadcast.*" matches both "broadcast_in" and "broadcast_out" data.
To use additional fine tuning for other performance data, the parameters can be used multiple times. In the next example, we keep the broadcast threshold and add another --warningx threshold for discards (discarded packets):
nagios@icinga:~$ /usr/lib/nagios/plugins/check_nwc_health
--hostname switch --community public --mode interface-usage --name
TwentyFiveGigE1/0/8 --warningx 'broadcast.*=101' --warningx 'discards.*=100'
OK - TwentyFiveGigE1/0/8 (alias TEL-G4-NETSW012-PO108) is up/up, interface TwentyFiveGigE1/0/8 (alias TEL-G4-NETSW012-PO108) usage is in:0.07% (670681.45bit/s) out:0.36% (3626112.73bit/s), interface TwentyFiveGigE1/0/8 (alias TEL-G4-NETSW012-PO108) errors in:0.00/s out:0.00/s , interface TwentyFiveGigE1/0/8 (alias TEL-G4-NETSW012-PO108) discards in:0.00/s out:0.00/s , interface TwentyFiveGigE1/0/8 (alias TEL-G4-NETSW012-PO108) broadcast in:0.42% out:0.02% | 'TwentyFiveGigE1/0/8_usage_in'=0.07%;80;90;0;100 'TwentyFiveGigE1/0/8_usage_out'=0.36%;80;90;0;100 'TwentyFiveGigE1/0/8_traffic_in'=670681.45;800000000;900000000;0;1000000000 'TwentyFiveGigE1/0/8_traffic_out'=3626112.73;800000000;900000000;0;1000000000 'TwentyFiveGigE1/0/8_errors_in'=0;1;10;; 'TwentyFiveGigE1/0/8_errors_out'=0;1;10;; 'TwentyFiveGigE1/0/8_discards_in'=0;100;10;; 'TwentyFiveGigE1/0/8_discards_out'=0;100;10;; 'TwentyFiveGigE1/0/8_broadcast_in'=0.42%;101;20;0;100 'TwentyFiveGigE1/0/8_broadcast_out'=0.02%;101;20;0;100
OK great, now we know how to fine-tune thresholds for each type of (performance) data returned from the check, by simply using the --warningx and --criticalx parameters several times. But how does that translate into Icinga 2?
If you've created your own CheckCommand definitions in the past, you already know how to assign a value to a parameter. Here's a very basic Icinga 2 CheckCommand definition for check_nwc_health:
# check_nwc_health definition added 20151104 by Claudio Kuenzler
object CheckCommand "check_nwc_health" {
import "plugin-check-command"
command = [ PluginDir + "/check_nwc_health" ]
arguments = {
"--hostname" = "$nwc_address$"
"--port" = "$nwc_port$"
"-t" = "$nwc_timeout$"
"--contextname" = "$nwc_contextname$"
"--protocol" = "$nwc_snmpversion$"
"--community" = "$nwc_snmpcom$"
"--username" = "$nwc_snmpusername$"
"--authpassword" = "$nwc_snmpauthpassword$"
"--authprotocol" = "$nwc_snmpauthprotocol$"
"--mode" = "$nwc_mode$"
"--name" = "$nwc_name$"
"--name2" = "$nwc_name2$"
"--role" = "$nwc_role$"
"--warning" = "$nwc_warning$"
"--critical" = "$nwc_critical$"
"--warningx" = "$nwc_warningx$"
"--criticalx" = "$nwc_criticalx$"
"--statefilesdir" = "$nwc_statefilesdir$"
"--ifspeed" = "$nwc_ifspeed$"
}
vars.nwc_address = "$address$"
vars.nwc_port = "161"
vars.nwc_snmpversion = "2c"
vars.nwc_snmpcom = "public"
vars.nwc_warningx = ".*broadcast.*=101"
vars.nwc_criticalx = ".*broadcast.*=101"
}
Note: This is a simplified CheckCommand definition, not all parameters of check_nwc_health are included here.
The defaults are appended after the arguments definition and contain the high broadcast thresholds from above. This invokes the check_nwc_health plugin with the following parameters:
/usr/lib/nagios/plugins/check_nwc_health --hostname [ip address of the host object] --port 161 --protocol 2c --community public --warningx ".*broadcast.*=101" --criticalx ".*broadcast.*=101"
Of course the --mode is not defined in the defaults, as this is set in a Service object.
But the problem here is how can we tell Icinga 2 to use the --warningx and --criticalx parameters multiple times?
Icinga's CheckCommand actually allows to run multiple times the same argument but this can quickly be missed in the documentation:
Parameters can use Array as value type. Whenever Icinga encounters an array, it repeats the parameter key and each value element by default.
A better explanation of this can actually be found in an issue (#7326) on Icinga's GitHub repos. dnsmichi, one of the original authors of Icinga 2, gave a great and easy to understand practical example:
object CheckCommand "my_simple_checkcommand" {
command = [ PluginDir + "/check_http" ]
arguments = {
"-a" = { value = "$foobar$" }
}
vars.foobar = [ 'one', 'two' ]
}
Translated into our own check_nwc_health CheckCommand definition, this means we change the defaults (vars.nwc_warningx and vars.nwc_criticalx) from a string to an array:
# check_nwc_health definition added 20151104 by Claudio Kuenzler
object CheckCommand "check_nwc_health" {
import "plugin-check-command"
command = [ PluginDir + "/check_nwc_health" ]
arguments = {
"--hostname" = "$nwc_address$"
"--port" = "$nwc_port$"
"-t" = "$nwc_timeout$"
"--contextname" = "$nwc_contextname$"
"--protocol" = "$nwc_snmpversion$"
"--community" = "$nwc_snmpcom$"
"--username" = "$nwc_snmpusername$"
"--authpassword" = "$nwc_snmpauthpassword$"
"--authprotocol" = "$nwc_snmpauthprotocol$"
"--mode" = "$nwc_mode$"
"--name" = "$nwc_name$"
"--name2" = "$nwc_name2$"
"--role" = "$nwc_role$"
"--warning" = "$nwc_warning$"
"--critical" = "$nwc_critical$"
"--warningx" = "$nwc_warningx$"
"--criticalx" = "$nwc_criticalx$"
"--statefilesdir" = "$nwc_statefilesdir$"
"--ifspeed" = "$nwc_ifspeed$"
}
vars.nwc_address = "$address$"
vars.nwc_port = "161"
vars.nwc_snmpversion = "2c"
vars.nwc_snmpcom = "public"
vars.nwc_warningx = [ ".*broadcast.*=101", ".*discards.*=50" ]
vars.nwc_criticalx = [ ".*broadcast.*=101", ".*discards.*=100" ]
}
In Icinga's user interface (Icingaweb2), the newly applied thresholds can nicely be seen:
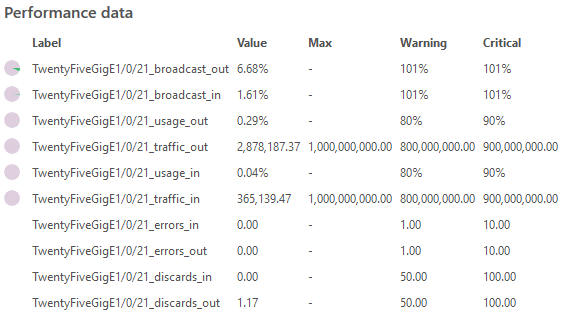
Both broadcast and discards warning thresholds are set according to the defaults from the CheckCommand definition.
No comments yet.

AI AWS Android Ansible Apache Apple Atlassian BSD Backup Bash Bluecoat CMS Chef Cloud Coding Consul Containers CouchDB DB DNS Databases Docker ELK Elasticsearch Filebeat FreeBSD Galera Git GlusterFS Grafana Graphics HAProxy HTML Hacks Hardware Icinga Influx Internet Java KVM Kibana Kodi Kubernetes LVM LXC Linux Logstash Mac Macintosh Mail MariaDB Minio MongoDB Monitoring Multimedia MySQL NFS Nagios Network Nginx OSSEC OTRS Observability Office OpenSearch PHP Perl Personal PostgreSQL PowerDNS Proxmox Proxy Python Rancher Rant Redis Roundcube SSL Samba Seafile Security Shell SmartOS Solaris Surveillance Systemd TLS Tomcat Ubuntu Unix VMware Varnish Virtualization Windows Wireless Wordpress Wyse ZFS Znuny Zoneminder