
Never underestimate the small things in life!
In this case, the tiny Bosch BME680 VOC sensor, soldered on a Adafruit break-out board, is not larger than a small coin. However it is able to accurately measure the environment around it - for example the air pressure, measured in HectoPascal (hpa).
The Adafruit BME680 chip is connected to the Raspberry Pi (I am using a Raspberry Pi 3b+) using the I2C connection. This uses a couple of pins on the GPIO headers. The Adafruit documentation shows how to correctly wire the chip.
After the headers (connector pins) were correctly soldered to the chip and wired to the Raspberry Pi, the sensor should be detected and seen in i2cdetect:
pi@raspberrypi:~ $ sudo i2cdetect -y 1
0 1 2 3 4 5 6 7 8 9 a b c d e f
00: -- -- -- -- -- -- -- -- -- -- -- -- --
10: -- -- -- -- -- -- -- -- -- -- -- -- -- -- -- --
20: -- -- -- -- -- -- -- -- -- -- -- -- -- -- -- --
30: -- -- -- -- -- -- -- -- -- -- -- -- -- -- -- --
40: -- -- -- -- -- -- -- -- -- -- -- -- -- -- -- --
50: -- -- -- -- -- -- -- -- -- -- -- -- -- -- -- --
60: -- -- -- -- -- -- -- -- -- -- -- -- -- -- -- --
70: -- -- -- -- -- -- -- 77
To retrieve the sensor data, there are two possibilities: Adafruit's own Python code, using CircuitPython and the BME680 extension for it or using the Bosch BSEC program, which is a closed source library for Bosch sensors.
After fiddling around with both of them and comparing sensor data, I decided to continue with Bosch's BSEC as the results were closer to reality. This combo has been running 24/7 since April 2020.
Note: The BME680 CircuitPython code has changed a lot since April 2020, which probably improved accuracy.
To continuously retrieve the data from the sensor, the check_bme680 monitoring plugin is used. Usually monitoring plugins consist of a single script being executed on a regular interval. In this case however, there are two parts:
The check_bme680 plugin is executed in a 1 minute interval. This is triggered by a central monitoring system (I am using Icinga 2) using a remote plugin execution program (such as NRPE).
pi@raspberrypi:~ $ grep voc /etc/nagios/nrpe_local.cfg
command[check_vocsensor]=/usr/lib/nagios/plugins/check_bme680.sh
When the plugin is executed, it returns the values both in output and performance data:
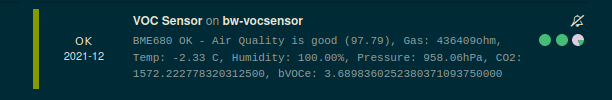
The performance data is picked up by Icinga and inserted into an InfluxDB timeseries database (using the InfluxdbWriter feature).
Now that the data is stored in InfluxDB, the data can be used to create some nice statistical graphs in Grafana:
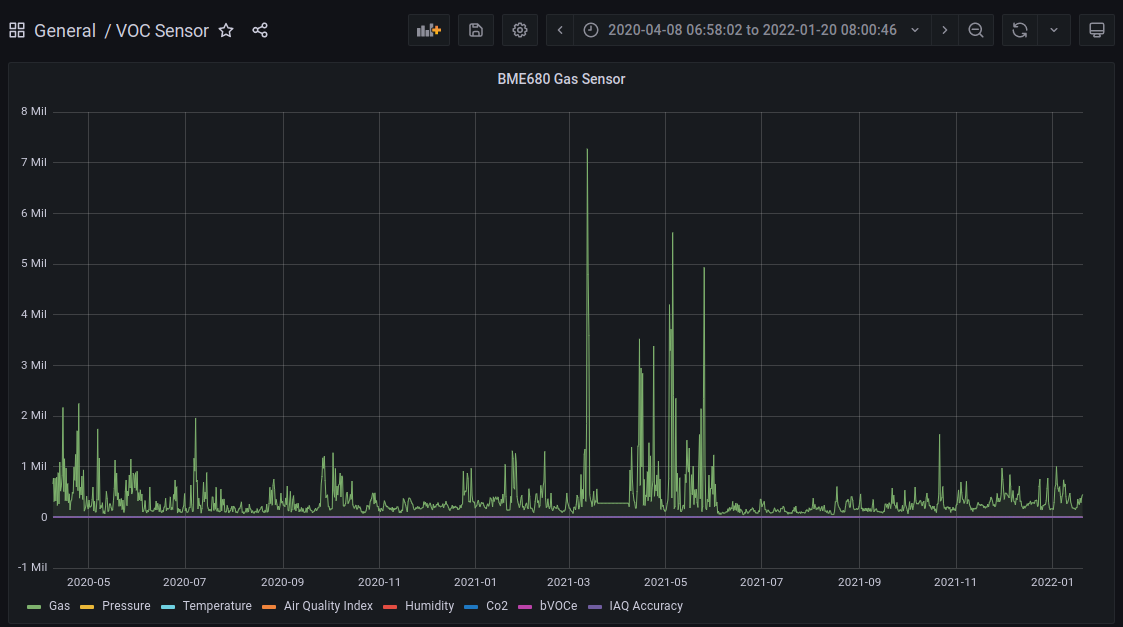
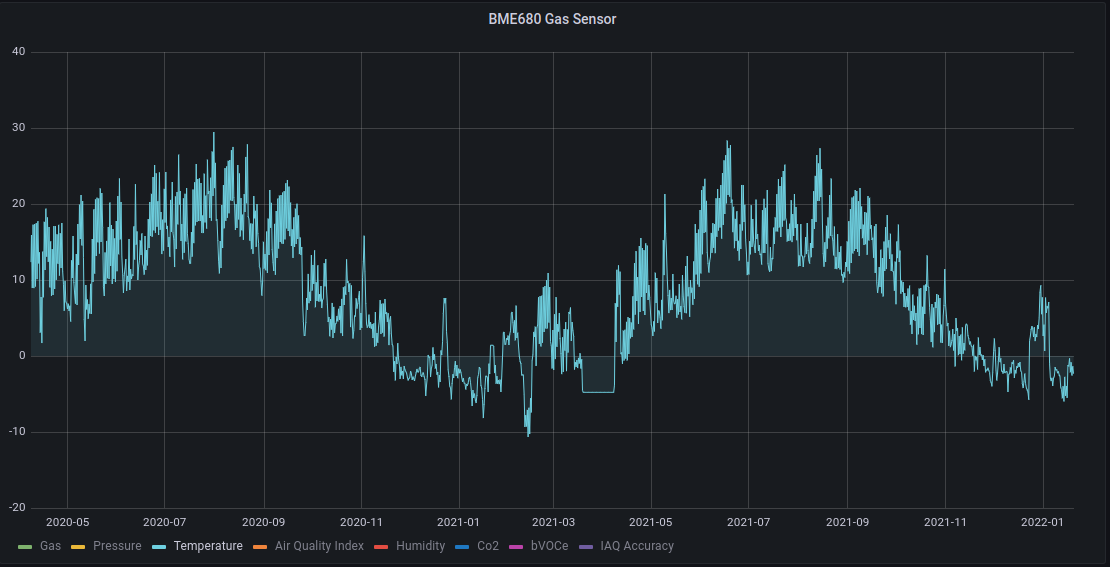
In my dashboard configuration, all metrics are shown by default in the same graph. By selecting a particular metric, the graph is adjusted for the selected metric (temperature here):
The eruption from the "Hunga Tonga Hunga Ha'apai" volcano in Tonga caused a massive shock-wave, which could be seen very well on satellite pictures:

Image courtesy: NOAA satellite, Space Videos on Youtube
This shock-wave traveled across the world. And even on the other side of the world, here in Switzerland, the shock-wave could be seen by looking at the air pressure. That's one of the environmental data the BME680 sensor picks up. And to my very surprise, the shock-wave could clearly be seen as a large spike, followed by a large drop:
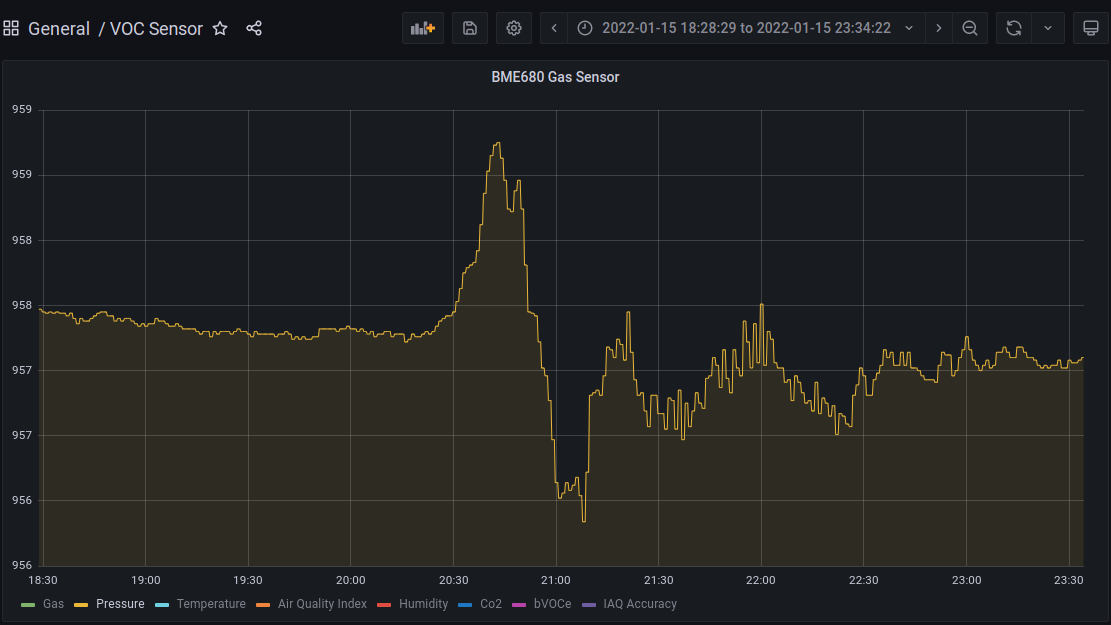
Even the second shock wave a few hours can very well be seen:

That's impressive! Especially when you think of the small size of the sensor!
No comments yet.

AI AWS Android Ansible Apache Apple Atlassian BSD Backup Bash Bluecoat CMS Chef Cloud Coding Consul Containers CouchDB DB DNS Databases Docker ELK Elasticsearch Filebeat FreeBSD Galera Git GlusterFS Grafana Graphics HAProxy HTML Hacks Hardware Icinga Influx Internet Java KVM Kibana Kodi Kubernetes LVM LXC Linux Logstash Mac Macintosh Mail MariaDB Minio MongoDB Monitoring Multimedia MySQL NFS Nagios Network Nginx OSSEC OTRS Observability Office OpenSearch PHP Perl Personal PostgreSQL PowerDNS Proxmox Proxy Python Rancher Rant Redis Roundcube SSL Samba Seafile Security Shell SmartOS Solaris Surveillance Systemd TLS Tomcat Ubuntu Unix VMware Varnish Virtualization Windows Wireless Wordpress Wyse ZFS Znuny Zoneminder