
Grafana is currently one of most widely used (and definitely one of the best) open source graphing tools. It allows to automatically create graphs from data/statistics, retrieved from a data source.
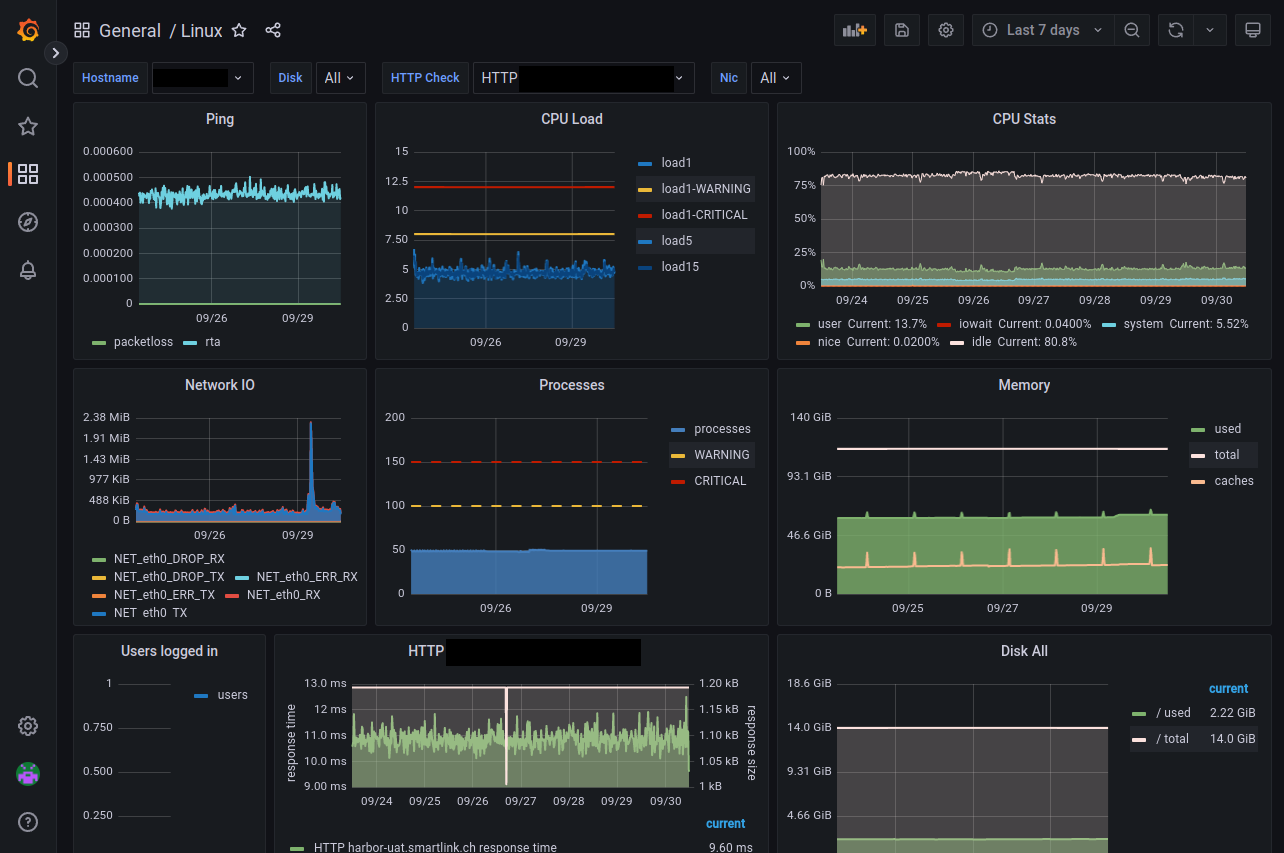
I've been using a monitoring combo (using Icinga2, InfluxDB and Grafana) for the last couple of years and use dashboards in Grafana to display the evolution of a monitored host and its services.
For monitoring memory usage, the monitoring plugin check_mem.pl is used on our servers. The plugin is able to show performance data in seperate values TOAL, USED, FREE and CACHES.
root@bullseye:~# /usr/lib/nagios/plugins/check_mem.pl -u -w 85 -c 95
OK - 74.6% (92297896 kB) used.|TOTAL=123747996KB;;;; USED=92297896KB;;;; FREE=31450100KB;;;; CACHES=24719348KB;;;;
By default the plugin uses the sum of USED+CACHES as used memory and compares it against the TOTAL value. By using the optional -C parameter, the plugin can be told that CACHES should not count as used memory:
root@bullseye:~# /usr/lib/nagios/plugins/check_mem.pl -u -w 85 -c 95 -C
OK - 54.6% (67582492 kB) used.|TOTAL=123747996KB;;;; USED=67582492KB;;;; FREE=56165504KB;;;; CACHES=24719516KB;;;;
Bam! 20% less memory used. In the dashboard above, the current memory graph shows exactly this data:
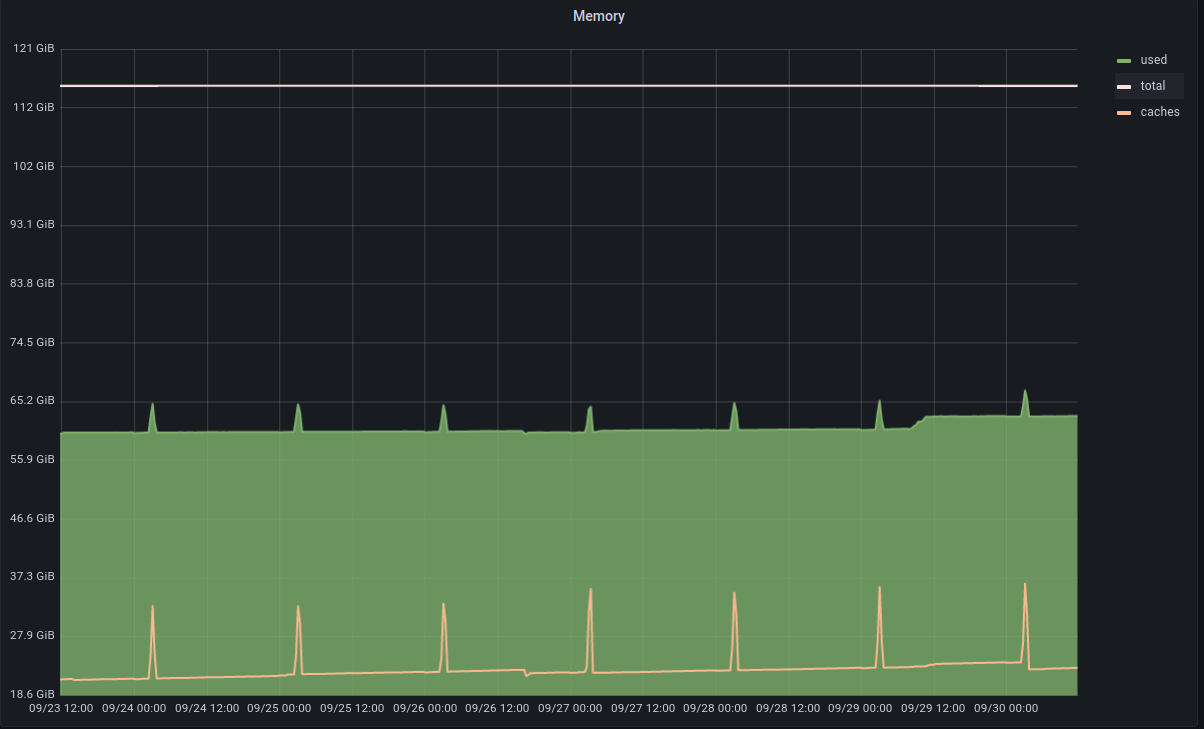
But unfortunately it's not just 1 and 0 with memory calculation. Although the CACHES indeed use memory space, this kind of memory is flexible. On Linux systems CACHES is (mostly) the file system(s) using buffered memory, which can be seen with the free command. That means the CACHES value is automatically higher when there's a lot of memory available on the server. But it can go very low, too, when applications require more memory space. However cannot go down to zero either because then the whole system would start swapping and most likely run into an OOM (out of memory) event.
Which one is correct then? USAGE = USED + CACHES or USAGE = USED? It depends. And that's why it is important to represent all these values with a different combination in the Memory graph. And this is, finally, where this article is headed.
The goal was to adjust the current memory graph (panel) to show the different (variable) situations:
When editing a panel in Grafana, the "Graph Styles" allows to use "stack the series". But enabling the "Stack series" (setting to Normal) just stacks all the series together (including TOTAL):
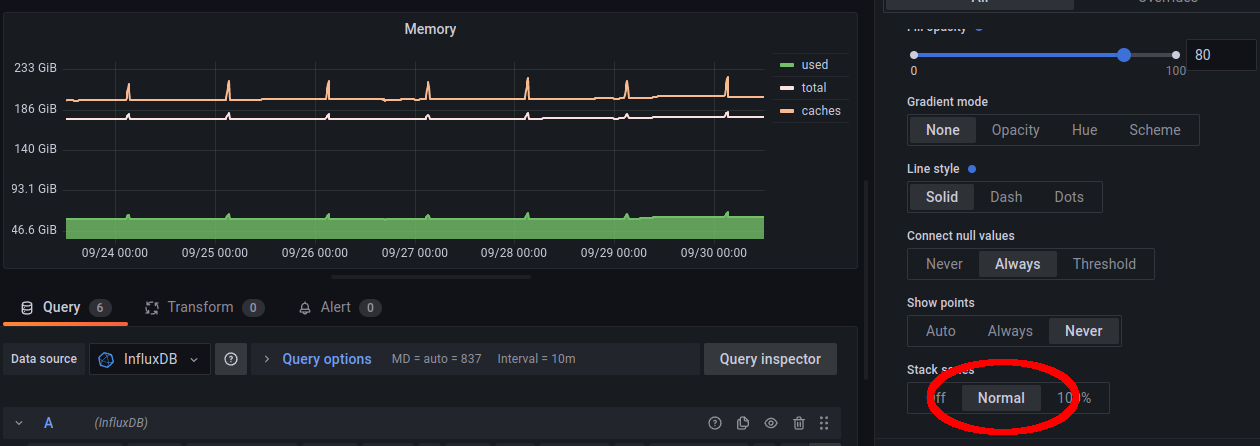
Basically the graph now represents all three data series (USED + TOTAL + CACHES) in a stacked graph, where CACHES is shown at the top of the graph showing the combined (stacked) lines.
Of course that doesn't make sense. The TOTAL value should not be stacked together with the other data series!
Instead of this, the Transform tab should be used. The functions behind that tab exactly do what it says: They transform an existing (or multiple) data series into something else/new.
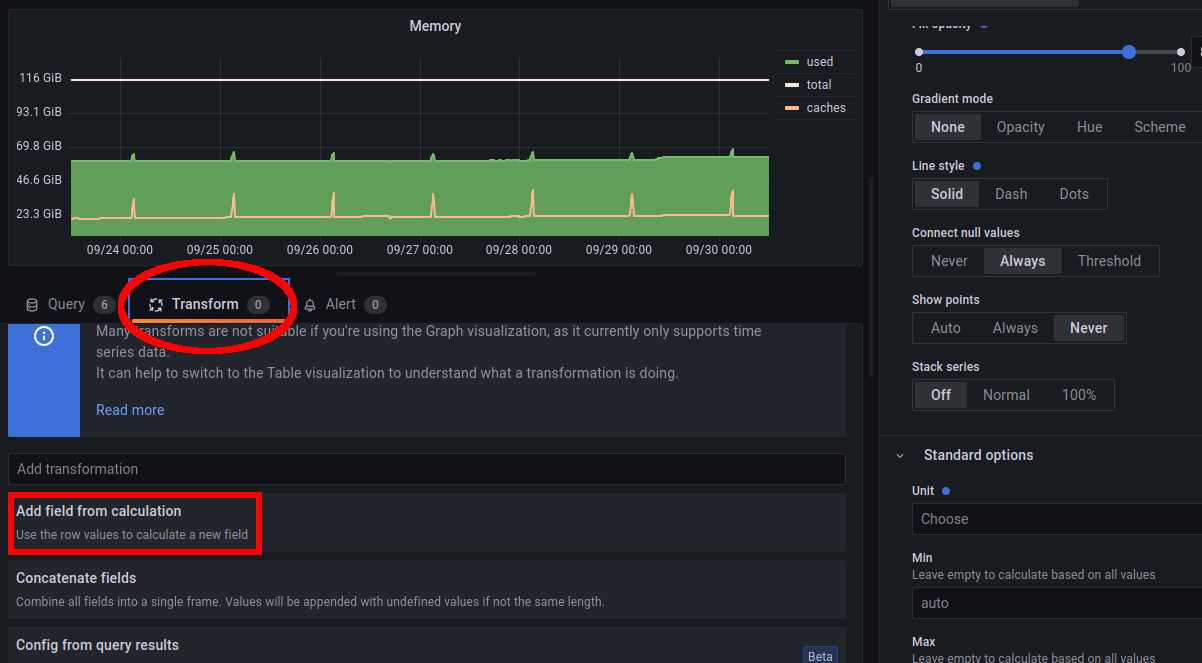
The first option "Add field from calculation" is already what we need in this situation: We want to create a new field from a calculation (USED + CACHES).
By changing the mode from the default (Reduce row) to Binary operation, you can easily run a calculation between two fields. In this case we use the fields "used" and "caches" and name the sum of it "used+caches":
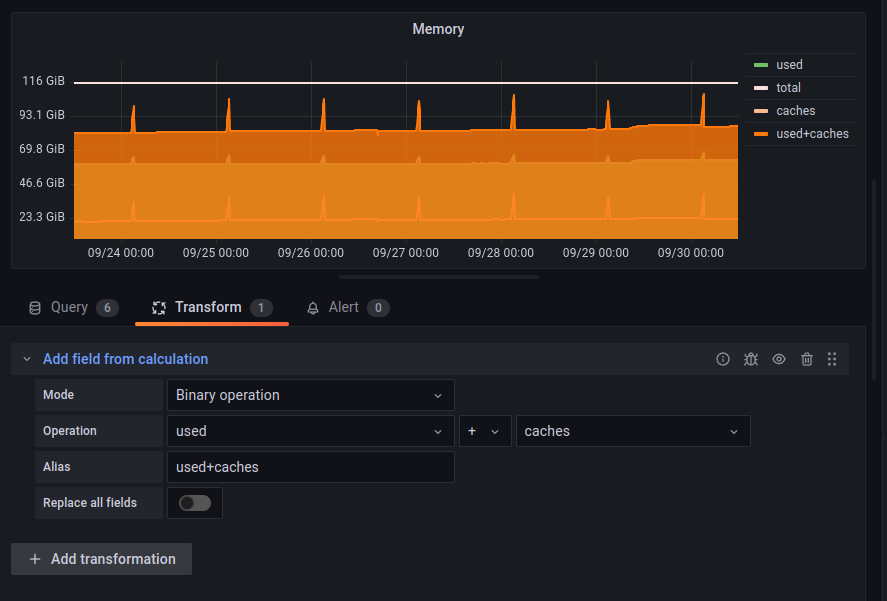
The new data series "used+caches" now shows up as orange line, laying on top of the other data series and covering them (due to the fill opacity).
To only display the line, select the "Overrides" tab on the right-hand side and create a new field override (+ Add field override). Choose the field name "used+caches" and select "Graph styles > Fill opacity" and set it to 0:
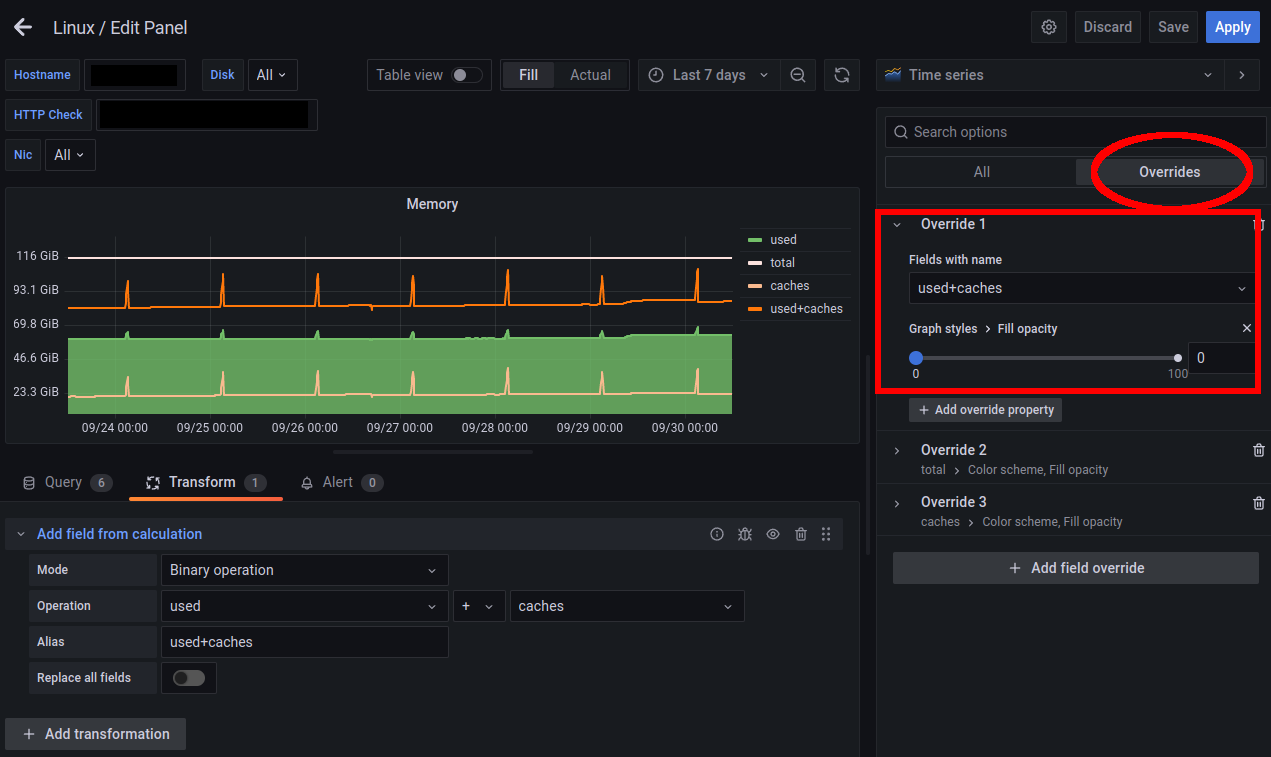
Now the data series "used+caches" shows up as line only, hovering on top of used and representing the value of "used + caches" combined.
Even though this value is very flexible, it still shows the current memory usage of the server, while keeping "caches" as its own data series.
No comments yet.

AI AWS Android Ansible Apache Apple Atlassian BSD Backup Bash Bluecoat CMS Chef Cloud Coding Consul Containers CouchDB DB DNS Databases Docker ELK Elasticsearch Filebeat FreeBSD Galera Git GlusterFS Grafana Graphics HAProxy HTML Hacks Hardware Icinga Influx Internet Java KVM Kibana Kodi Kubernetes LVM LXC Linux Logstash Mac Macintosh Mail MariaDB Minio MongoDB Monitoring Multimedia MySQL NFS Nagios Network Nginx OSSEC OTRS Observability Office OpenSearch PHP Perl Personal PostgreSQL PowerDNS Proxmox Proxy Python Rancher Rant Redis Roundcube SSL Samba Seafile Security Shell SmartOS Solaris Surveillance Systemd TLS Tomcat Ubuntu Unix VMware Varnish Virtualization Windows Wireless Wordpress Wyse ZFS Znuny Zoneminder