
While working on a Bash script, which should be used for per process memory monitoring, I came across a couple of hurdles. Besides running into the everlasting question "how to see the real memory usage?" I also ran into unexpected permission problems caused by capabilities. But let's start from the beginning.
A single process has a single process ID (PID) and has all its statistics in one place: /proc/<PID>/. Pretty accurate memory usage calculations can therefore be made. A Java process for example usually runs as a single process:
ck@linux:~$ ps -C java -o pid,rss:8,cmd
PID RSS CMD
15201 3899912 /opt/atlassian/jira/jre//bin/java -Djava.util.logging.config.file
Using the discovered PID (15201) we can retrieve the memory statistics. There are a couple of ways to do this as several files inside /proc/<PID>/ contain memory information of the process The preferred method, at least to the human eye, would be reading memory statistics from /proc/<PID>/status. This contains quite a lot of information. With a grep for the lines starting with "Vm..." we can find the memory related information:
ck@linux:~$ cat /proc/15201/status | grep '^Vm'
VmPeak: 17798556 kB
VmSize: 17545436 kB
VmLck: 0 kB
VmPin: 0 kB
VmHWM: 4048832 kB
VmRSS: 3899852 kB
VmData: 4501972 kB
VmStk: 136 kB
VmExe: 4 kB
VmLib: 25188 kB
VmPTE: 9840 kB
VmSwap: 0 kB
From this output, we can see the VMSize entry showing 17545436 kB (= 17134 MB = 16.73 GB) and the VmRSS entry showing 3899852 kB (= 3808.45 MB). Comparing this data with htop shows the same values:
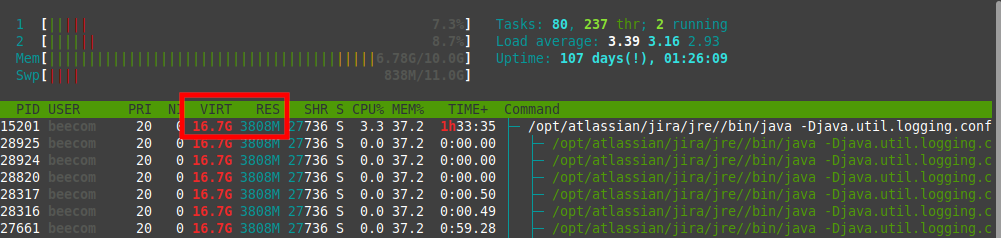
From the htop output we can also see the total capacity of memory on this machine is 10 GB and the current overall usage is calculated at 6.78 GB. So the VmSize from /proc/PID/status and VIRT column in htop are far off. Does this mean the VmRSS/RES value is the real memory usage? Close, but still not 100% accurate.
The RSS value represents the process' memory usage including shared memory.
ck@linux:~$ cat /proc/15201/status | grep '^VmRSS:'
VmRSS: 3899852 kB
The value is a calculation of three different RSS values (which can also be found in /proc/<PID>/status):
VmRSS = RssAnon + RssFile + RssSHmem
Shared memory means objects used in memory which are used by other processes. Such objects are in most cases shared (system) libraries. A good explanation can be found on StackExchange:
RSS is the total number of pages, shared or not, currently mapped into the process.
Although RSS represents a roughly correct memory usage of a process, it also contains memory resources used by other processes. A more accurate way to show the process' "real" memory usage would therefore be a value without the shared memory. This is where PSS comes in.
PSS is short for Proportional Set Size and shows the private memory of the process itself and a partitioned size of the shared memory. Partitioned in this case means "amount of shared memory divided by number of processes". From the /proc documentation:
The proportional set size (PSS) of a process is the count of pages it has in memory, where each page is divided by the number of processes sharing it. So if a process has 1000 pages all to itself, and 1000 shared with one other process, its PSS will be 1500.
PSS should therefore represent a more accurate (private) memory usage of a process, yet it still contains a (smaller) amount of some shared memory objects.
The PSS value can only be found in /proc/<PID>/smaps and shows an entry for each allocated memory object:
ck@linux:~$ sudo grep '^Pss' /proc/15201/smaps | head
Pss: 2169580 kB
Pss: 0 kB
Pss: 4 kB
Pss: 4 kB
Pss: 4 kB
Pss: 120 kB
Pss: 96 kB
Pss: 872 kB
Pss: 352 kB
Pss: 52 kB
[...]
To combine all these values together, we can use the following awk one-liner (found on depesz' blog):
ck@linux:~$ sudo grep '^Pss' /proc/15201/smaps | awk '{A+=$2} END{print A}'
3902205
The PSS value for this single Java process is therefore 3902205 KB (= 3810 MB). In this particular case the PSS value is the same as the RSS value. This is mainly because this Java process is from a bundled Atlassian Jira package which has (almost) all the needed libraries in a dedicated path, therefore not sharing with other processes.
The problem with obtaining the PSS value is the read access to /proc/<PID>/smaps. Although this file has permissions set to 644 (write-read-read), it cannot be read from non-privileged users:
ck@linux:~$ grep '^Pss' /proc/15201/smaps
grep: /proc/15201/smaps: Permission denied
The permission denied error in this case comes from missing but required capabilities which are needed to access /proc/<PID>/smaps (also applies to some other files within /proc/<PID>) .
So far we have RSS (memory usage including shared memory), PSS (memory usage with some shared memory). But is there a way to find the private memory usage of a process without any shared memory? Yes there is: USS.
USS is short for Unique Set Size and represents the private memory of a process (only allocated to this process). USS itself is not an existing value but it needs to be calculated from the process' "Private_Clean" and "Private_Dirty" values. The formula is therefore:
USS = Private_Clean + Private_Dirty
Once again these values can be found in /proc/<PID>/smaps.
ck@linux:~$ sudo egrep '^Private(_Dirty|_Clean)' /proc/15201/smaps | head
Private_Clean: 0 kB
Private_Dirty: 2169580 kB
Private_Clean: 0 kB
Private_Dirty: 0 kB
Private_Clean: 4 kB
Private_Dirty: 0 kB
Private_Clean: 0 kB
Private_Dirty: 4 kB
Private_Clean: 0 kB
Private_Dirty: 4 kB
Using the awk command from above again, we can obtain the sum of all Private_Clean and Private_Dirty values:
ck@linux:~$ sudo egrep '^Private(_Dirty|_Clean)' /proc/15201/smaps | awk '{A+=$2} END{print A}'
3902176
The USS value is therefore 3902176 KB (= 3810 MB). Once again this is the same value as RSS and PSS and can (in this particular case) be explained with the Atlassian Jira Java process using only dedicated paths and libraries and not sharing resources with other (system) processes.
The above example with the Java process from an Atlassian Jira installation only uses dedicated paths, loads Java and its libraries from these paths and not sharing resources with other processes. Let's show RSS/PSS/USS from another single process, heavily integrated into (today's) Linux Operating System: systemd-journald.
ck@linux:~$ ps -u root -o pid,cmd | grep journald
260 /lib/systemd/systemd-journald
Obtain RSS/PSS/USS from that PID 260:
# RSS Memory Usage of process systemd-journald
ck@linux:~$ cat /proc/260/status | grep '^VmRSS:'
VmRSS: 22516 kB
# PSS Memory Usage of process systemd-journald
ck@linux:~$ sudo grep '^Pss' /proc/260/smaps | awk '{A+=$2} END{print A}'
16512
# USS Memory Usage of process systemd-journald
ck@linux:~$ sudo egrep '^Private(_Dirty|_Clean)' /proc/260/smaps | awk '{A+=$2} END{print A}'
16020
Here we can see a rather big difference:
Looking at the htop output shows again the matching RSS value in the output:
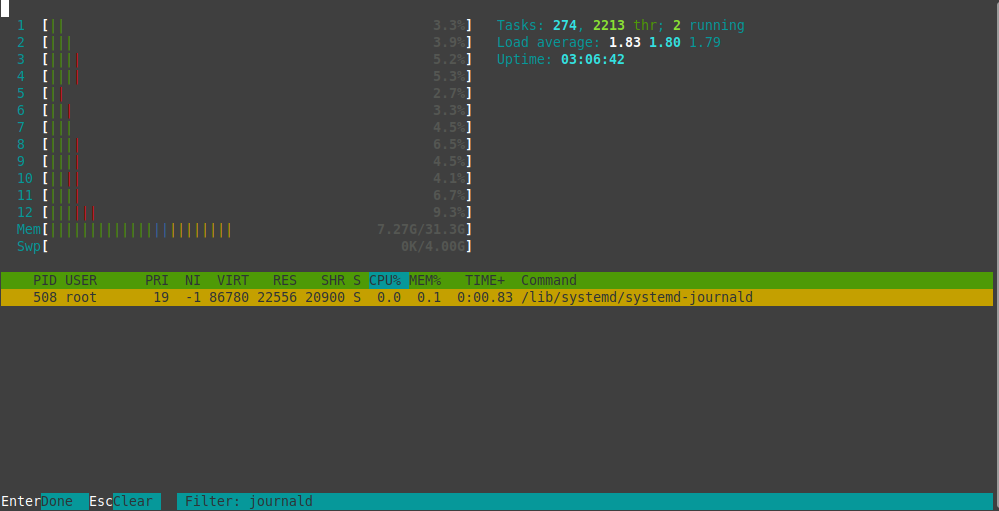
However the real memory usage of this systemd-journald process (without shared memory) would be somewhat around 16 MB (and not 22 MB from RSS).
Most of the known tools and commands, such as ps or htop, only show the RSS/Resident memory size of a process. But smem is a command which shows all three memory usage types. It can easily be installed as system package:
ck@linux:~$ sudo apt install smem
And a simple launch of sudo smem shows RSS/PSS/USS of all running processes. With the parameter -P a specific (regex) filter can be applied to only show specific processes:
ck@linux:~$ sudo smem -P journald
PID User Command Swap USS PSS RSS
31193 root sudo smem -P journald 0 1544 1772 5616
31194 root /usr/bin/python3 /usr/bin/s 0 6896 7256 13336
508 root /lib/systemd/systemd-journa 0 16516 17009 23032
smem uses /proc/<PID>/smaps in the background to do the same memory calculation as shown above. This means smem needs to be run with privileged rights, aka. sudo.
The above examples show how to obtain RSS/PSS/USS memory usage of a single process. But what about multi-process applications which have forked multiple child processes? There are many examples of such applications, such as PostgreSQL, Nginx, Apache, SSHD and many many more. Let's focus on PostgreSQL in this article.
PostgreSQL itself has a main process managing the different child processes. This can be seen nicely in the tree view in htop:
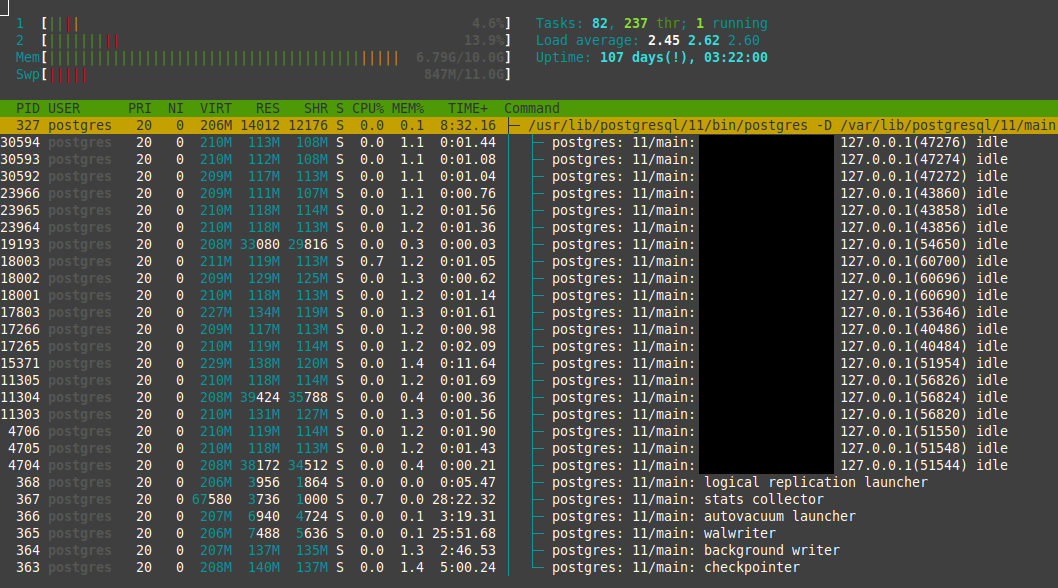
From the RES (RSS) column we can see that each process has it's own value and they can differ a lot. Especially when a lot of queries are happening on one of the connection processes, the memory usage can quickly spike up and down. To calculate the overall memory usage of the PostgreSQL we need to "loop" through all the child processes.
To do that, let's first retrieve a list of all the current process id's related to postgres:
ck@linux:~$ pgrep -a -f "postgres" | awk '{print $1}' | tr "\n" " "
327 363 364 365 366 367 368 4704 4705 4706 11303 11304 11305 15371 17803 18001 18002 18003 19193 23965 24654 24655 24656 30594 31280 31281 31282
With this list we can now loop through all these processes and obtain RSS/PSS/USS for each PID. Let's do RSS first:
ck@linux:~$ for pid in $(pgrep -a -f "postgres" | awk '{print $1}' | tr "\n" " "); do grep 'VmRSS:' "/proc/${pid}/status" | awk -F' ' '{print $2}'; done
14012
144052
141268
7488
6940
3736
3956
38172
120976
121892
134976
39424
121612
141968
137628
122356
132440
122364
33080
121768
119500
115160
120812
115832
118700
42312
120536
Of course we should sum all these values while running through the loop:
ck@linux:~$ vmRSS=0; for pid in $(pgrep -a -f "postgres" | awk '{print $1}' | tr "\n" " "); do vmRSS=$((vmRSS + $(grep 'VmRSS:' "/proc/${pid}/status" | awk -F' ' '{print $2}'))); done; echo $vmRSS
2312184
According to that calculation all PostgreSQL processes combined currently use 2312184 KB (~2257.99 MB ~ 2.2 GB), including shared memory.
The same approach can be used for PSS but here we need to keep in mind we need elevated privileges to access the PID's smaps file:
ck@linux:~$ vmPSS=0; for pid in $(pgrep -a -f "postgres" | awk '{print $1}' | tr "\n" " "); do vmPSS=$((vmPSS + $(sudo grep '^Pss' /proc/${pid}/smaps | awk '{A+=$2} END{print A}'))); done; echo $vmPSS
239495
Note: Short-lived processes might disappear during the loop and the smaps file is gone. You could add a if condition (if [ -r /proc/${pid}/smaps ]; then...) if the file is readable before running grep.
After this loop, we now have the PSS memory usage of all PostgreSQL processes combined: 239495 KB (~ 233.88 MB). Of course this is a lot less than RSS but actually is a more accurate memory usage of PostgreSQL itself.
And the last candidate is USS, which we know we can obtain by adding Private_Dirty and Private_Clean memory values:
ck@linux:~$ vmUSS=0; for pid in $(pgrep -a -f "postgres" | awk '{print $1}' | tr "\n" " "); do vmUSS=$((vmUSS + $(sudo egrep '^Private(_Dirty|_Clean)' /proc/${pid}/smaps | awk '{A+=$2} END{print A}'))); done; echo $vmUSS
87124
Now we also know the USS memory usage of all PostgreSQL processes combined: 87124 KB (~ 85 MB).
Looking at the combined RSS/PSS/USS values, the PSS value seems to make most accurate representation of actual memory usage.
But is the calculation of the combined processes actually correct? Let's verify this with atop.
atop is another smart process and performance display command. Compared to top or htop, atop is capable of combining resource usage of child processes.
Once installed (sudo apt install atop), atop can be launched. Once started, use the following keystrokes:
Unfortunately it won't show PSS or USS but we can at least verify the combined RSS value:
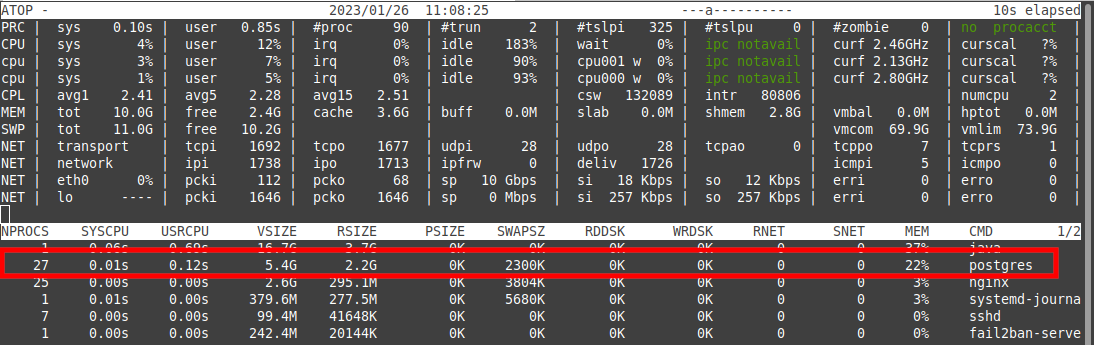
We can see the combined RSIZE value is 2.2 GB, which matches the result from the for loop above. The summary calculation is therefore correct.
Of course all of this needs to be automated. For this purpose Denny Zhang's script check_proc_mem.sh was forked and adjusted to support multi-process memory calculations (using -r "regex") and added PSS/USS memory usage (when run as root):
ck@linux:~$ sudo /usr/lib/nagios/plugins/check_proc_mem.sh -w 2048 -c 4096 -r "postgres"
Memory: WARNING PSS: 235 MB - USS: 89 MB - RES: 2463 MB - VIRT: 5557 MB used!|PSS=246415360B;;;; RES=2582642688B;;;; VIRT=5826936832B;;;;
Without elevated privileges the script will not show PSS/USS values:
ck@linux:~$ /usr/lib/nagios/plugins/check_proc_mem.sh -w 2048 -c 4096 -r "postgres"
Memory: WARNING RES: 2289 MB - VIRT: 5544 MB used!|PSS=0B;;;; RES=2400190464B;;;; VIRT=5813305344B;;;;
The script can also be used with a single PID (for example for the Java process):
ck@linux:~$ sudo /usr/lib/nagios/plugins/check_proc_mem.sh -w 2048 -c 4096 -p 15201
Memory: WARNING PSS: 3814 MB - USS: 0 MB - RES: 3814 MB - VIRT: 17134 MB used!|PSS=3999268864B;;;; RES=3999268864B;;;; VIRT=17966301184B;;;;
Or with a pid file:
ck@linux:~$ sudo /usr/lib/nagios/plugins/check_proc_mem.sh -w 2048 -c 4096 -f /opt/atlassian/jira/work/catalina.pid
Memory: WARNING PSS: 3814 MB - USS: 0 MB - RES: 3814 MB - VIRT: 17134 MB used!|PSS=3999268864B;;;; RES=3999268864B;;;; VIRT=17966301184B;;;;
If you have worked with monitoring plugins in the past, you will notice the performance data added at the end of the script output. This can now nicely be used to create long-term graphs, showing memory usage of a single application:
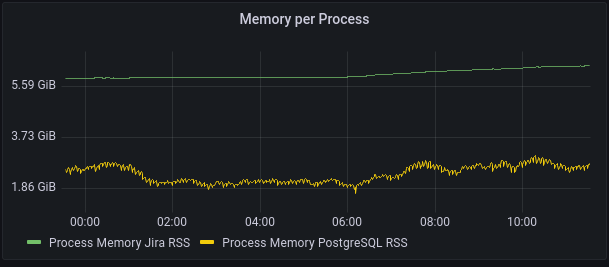
Although in this graph we only show the RSS value (because the monitoring script is run without sudo), it still shows when PostgreSQL is increasing or decreasing its memory usage (by looking at the baseline). For the Java process launched by Jira the value can be seen as real memory usage as there is (almost no) shared memory used.
The forked version of check_proc_mem.sh will be shared publicly after some internal evaluation and testing phase.
Looking at the memory graphs over the past few days leads us to the (initial) conclusion that either PSS or an average between RSS and PSS can be used as indicator for real memory usage of an application.
No comments yet.

AI AWS Android Ansible Apache Apple Atlassian BSD Backup Bash Bluecoat CMS Chef Cloud Coding Consul Containers CouchDB DB DNS Databases Docker ELK Elasticsearch Filebeat FreeBSD Galera Git GlusterFS Grafana Graphics HAProxy HTML Hacks Hardware Icinga Influx Internet Java KVM Kibana Kodi Kubernetes LVM LXC Linux Logstash Mac Macintosh Mail MariaDB Minio MongoDB Monitoring Multimedia MySQL NFS Nagios Network Nginx OSSEC OTRS Observability Office OpenSearch PHP Perl Personal PostgreSQL PowerDNS Proxmox Proxy Python Rancher Rant Redis Roundcube SSL Samba Seafile Security Shell SmartOS Solaris Surveillance Systemd TLS Tomcat Ubuntu Unix VMware Varnish Virtualization Windows Wireless Wordpress Wyse ZFS Znuny Zoneminder