
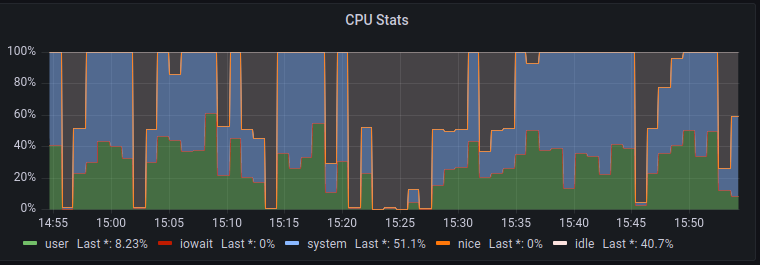
A few days ago I was helping a customer with a serious Wordpress issue: The backend was so slow, it was barely usable. Whenever a file was uploaded, the (dedicated) server spiked up CPU usage to 100%.
We're hosting quite a few dedicated Wordpress servers at Infiniroot, so I was surprised that one particular Wordpress instance would run into such performance issues. In fact, that very Wordpress installation contains a lot of (large) plugins and extensions, such as WPML and Woocommerce. Both are known to significantly slow down a Wordpress installation. But still, with dedicated resources and a decent number of CPUs, the usage should never reach 100%.
Let's dig deeper, to find the reason.
The customer was able to reproduce the slowness by simply uploading some media files. By looking at the Apache status and by using strace of the PHP-FPM processes at the same time, we spotted a couple of URLs being "stuck" in sending reply (W):
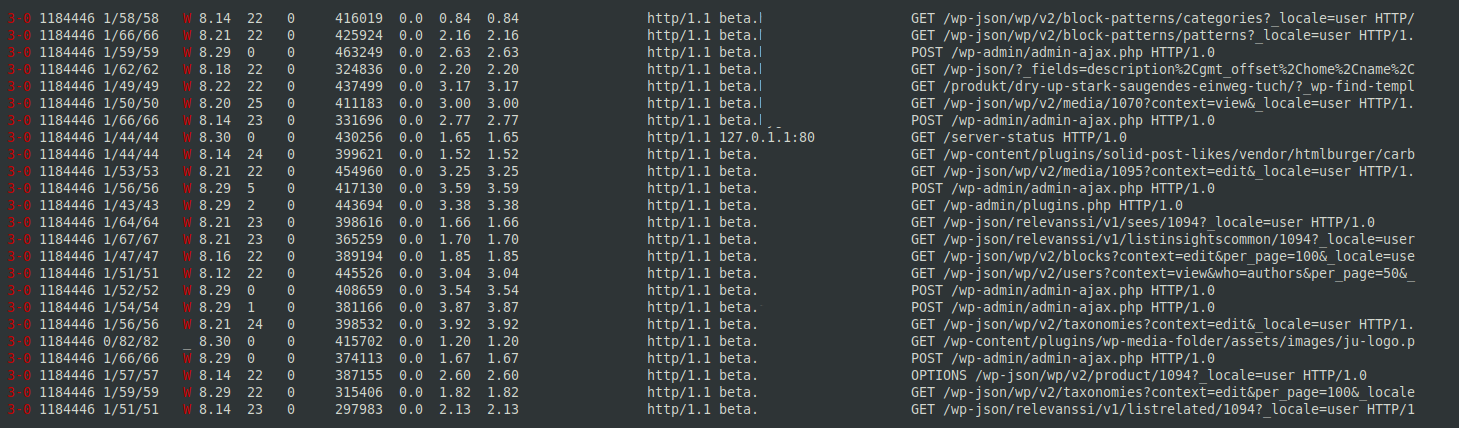
This could be an indication that a loop is happening somewhere, within one of the PHP scripts.
To find out what's happening in the background, we used strace on the PHP-FPM processes. The strace output showed a lot of ENOENT errors (No such file or directory) from certain plugins, especially the swiss-qr-bill plugin:
[...]
1193677 access("/var/www/beta.example.com/wp-content/plugins/swiss-qr-bill/vendor/composer/../wp-cli/extension-command/src/WPMailSMTP/Admin/Notifications.php", F_OK) = -1 ENOENT (No such file or directory)
1193677 access("/var/www/beta.example.com/wp-content/plugins/swiss-qr-bill/vendor/composer/../wp-cli/export-command/src/WPMailSMTP/Admin/Notifications.php", F_OK) = -1 ENOENT (No such file or directory)
1193677 access("/var/www/beta.example.com/wp-content/plugins/swiss-qr-bill/vendor/composer/../wp-cli/eval-command/src/WPMailSMTP/Admin/Notifications.php", F_OK) = -1 ENOENT (No such file or directory)
1193677 access("/var/www/beta.example.com/wp-content/plugins/swiss-qr-bill/vendor/composer/../wp-cli/entity-command/src/WPMailSMTP/Admin/Notifications.php", F_OK) = -1 ENOENT (No such file or directory)
1193677 access("/var/www/beta.example.com/wp-content/plugins/swiss-qr-bill/vendor/composer/../wp-cli/db-command/src/WPMailSMTP/Admin/Notifications.php", F_OK) = -1 ENOENT (No such file or directory)
[...]
This led us to initially assume a loop in one of the plugins, causing the high CPU usage and therefore the slowness. In this example, the plugin does indeed slow down Wordpress a bit as it is looking for the file "Notifications.php" within multiple paths. This could definitely be improved, but this is still not the reason for a huge CPU spike.
We went on to disable one plugin after another to find which plugin would cause the slowness. But even after disabling almost all plugins, the backend was still considered slower than on other Wordpress instances.
We decided to go deeper and look for files which are accessed during such an upload process - and how often these files are opened by the PHP process. By using bpftrace this can be achieved in a similar way to using dtrace and its "count" ability.
root@server:~# bpftrace -e 'tracepoint:syscalls:sys_enter_openat /comm == "php-fpm7.4"/ {@[str(args->filename)] = count(); } interval:s:5 { time(); print(@); clear(@); }'
Attaching 2 probes...
13:15:19
13:15:24
[...]
@[/var/www/beta.example.com/wp-content/plugins/wp-migrate-db-]: 63
@[/var/www/beta.example.com/wp-content/mu-plugins]: 76
@[/var/www/beta.example.com/wp-content/plugins/wp-mail-loggin]: 99
@[/var/www/beta.example.com/wp-content/plugins/sitepress-mult]: 119
@[/var/www/beta.example.com/wp-content/languages/plugins/wooc]: 137
@[/var/www/beta.example.com/wp-content/plugins/woocommerce/pa]: 257
@[/usr/lib/x86_64-linux-gnu/ImageMagick-6.9.11/modules-Q16/coders]: 1184
The bpftrace command above counts and sorts all opened files by the php-fpm7.4 process within a 5 second interval. At the end of each interval, the paths are listed with the count.
We were quite surprised to find Imagemagick being called so often (almost 1200 times) within 5 seconds. The second most opened file was 5x less opened. What is happening inside the PHP process?
By using perf and Brendan Gregg's Flamegraph scripts, the process and its stack can be analyzed visually.
root@server ~ # git clone https://github.com/brendangregg/FlameGraph
root@server ~ # cd FlameGraph/
root@server ~ # perf record -F 99 -a -g -- sleep 60
root@server ~ # perf script | ./stackcollapse-perf.pl > out.perf-folded
root@server ~ # ./flamegraph.pl out.perf-folded > perf.svg
This resulted in the following flame graph:
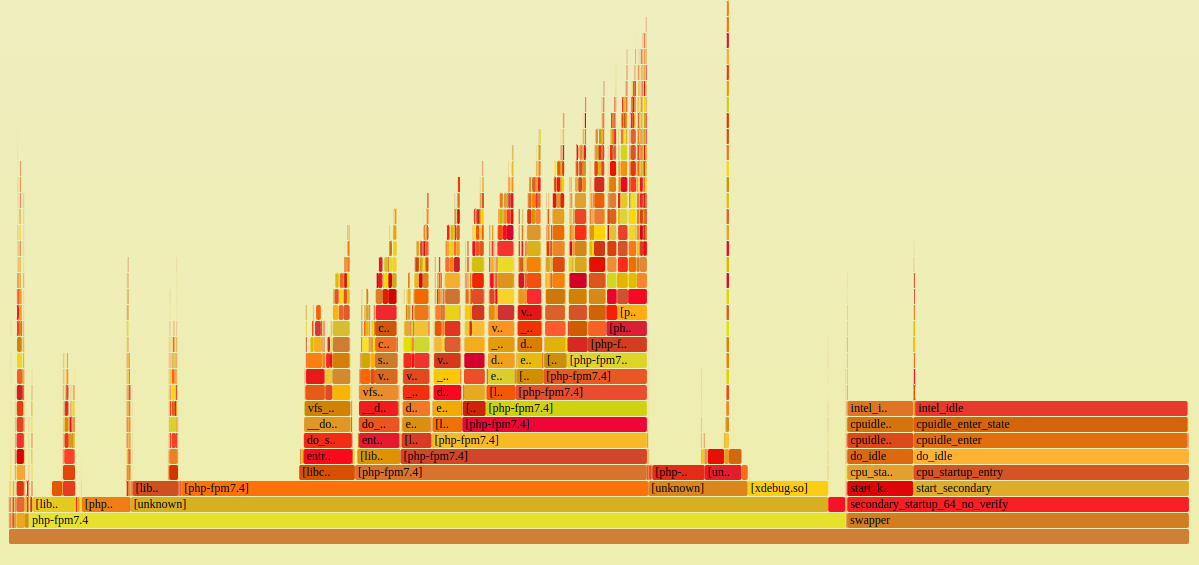
The focus needs to be set on the large php-fpm7.4 process, which itself launches other php-fpm7.4 processes. By looking at this graph, we can't but thinking of a loop - again. But is it?
While analyzing the graph, other options have also been tested. Moving to a different physical server? Same result! Switching from ImageMagick to PHP's gd for image processing? A bit better, but still higher than usual CPU usage!
Eventually the discussion led to whether or not PHP's object cache could be having an issue. And this was the moment we realized, that APC (the current PHP Cache/Accelerator) was not enabled on that Wordpress server instance.
Would it make such a big difference? We installed the php7.4-apc package and launched the tests again.
During the file uploads in the backend, we could already see on htop that CPU usage was less than before. With the same bpftrace command from before we also realized that the syscalls to ImageMagick decreased significantly, almost by half:
[...]
@[/var/www/beta.example.com/wp-content/plugins/wp-mail-loggin]: 75
@[/var/www/beta.example.com/wp-content/plugins/sitepress-mult]: 77
@[/var/www/beta.example.com/wp-content/languages/plugins/wooc]: 157
@[/var/www/beta.example.com/wp-content/plugins/miniorange-oau]: 321
@[/var/www/beta.example.com/wp-content/plugins/woocommerce/pa]: 432
@[/usr/lib/x86_64-linux-gnu/ImageMagick-6.9.11/modules-Q16/coders]: 715
There's definitely evidence that performance is better.
At this point we have a before and after APC situation. The first Flamegraph was created without accelerated PHP through APC. To eventually spot a (real) difference, we created another stack graph; this time with APC installed.
And indeed, we spotted something barely noticeable but significant: The usage of the code compiler (libc)!
The Flamegraph above shows the PHP-FPM process stack during upload process without APC installed. We can clearly see that whenever php-fpm7.4 is executed, it is followed by opening libc-2.31.so (36.8% match case). This is the GNU C library, which compiles the PHP code into C code. As there is no APC/PHP accelerator installed in this situation, the PHP code needs to be compiled every single time.
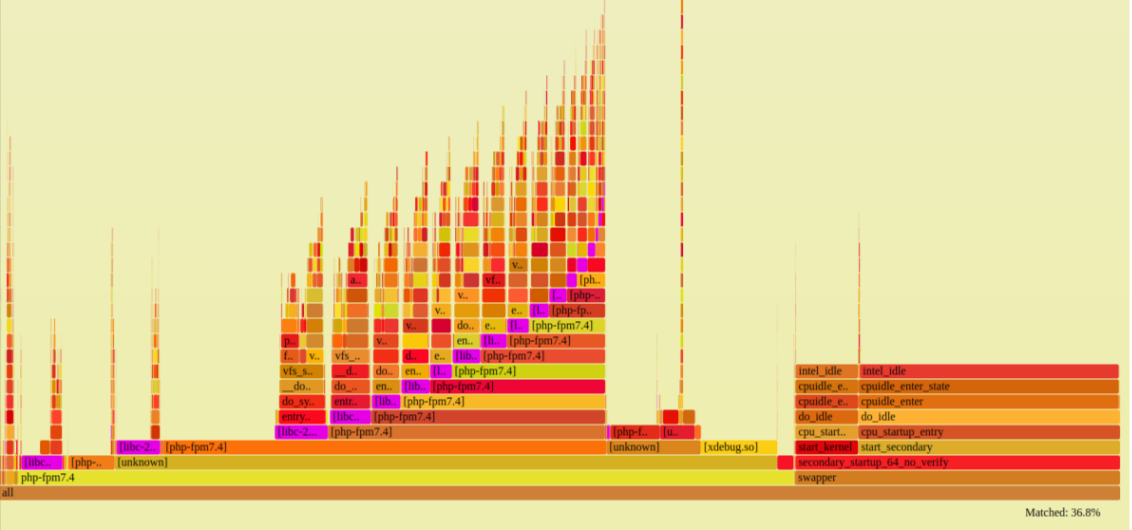
Now let's compare this to the Flamegraph when APC is installed:
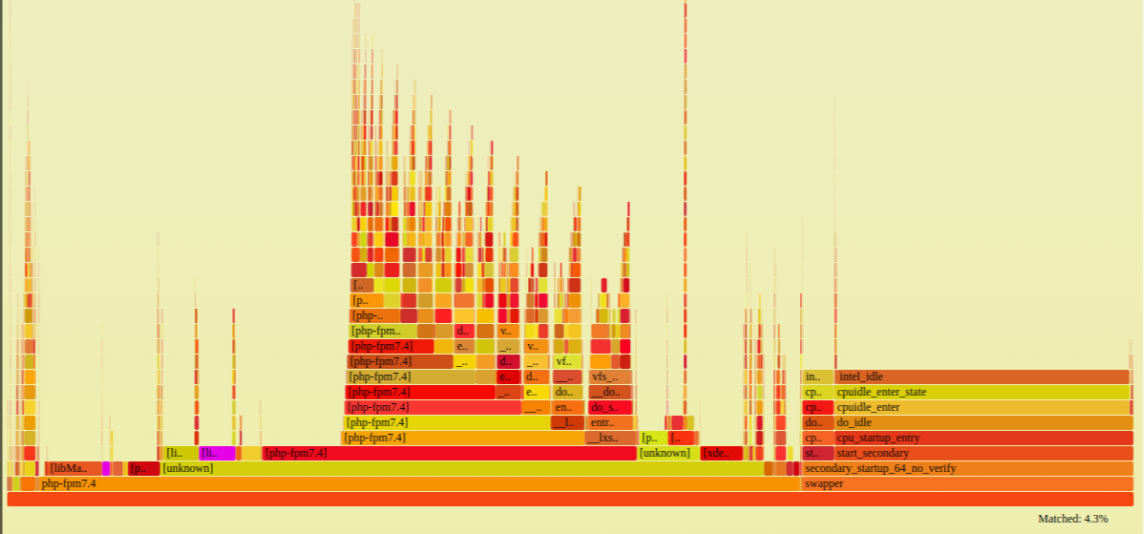
This time we can only spot two occurrences (highlighted in violet) of libc-2.31.so in this case (4.3% match case).
Now it all makes sense: Because APC was not installed, each PHP code/script needed to be compiled every time. With APC installed, the code compiling only happens once and then resides in PHP's object cache (in memory), which significantly speeds up the handling of PHP script. The Flamegraph above nicely represents this. Although the graphs do not show the actual CPU usage of the compiler, everybody knows that code compiling is very CPU intensive.
This particular Wordpress instance still remains a large installation, requiring lot of resources. But thanks to the analysis and enabled PHP acceleration using APC, the CPU usage is now at an expected level, especially during heavy backend work:
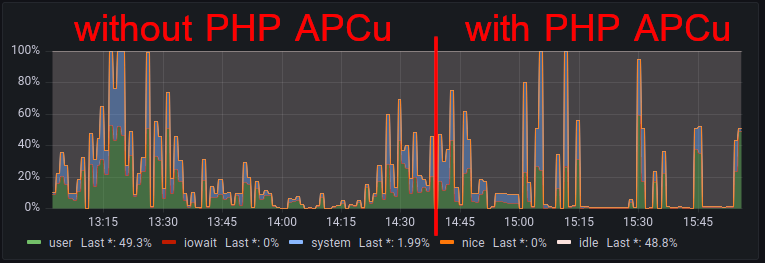
PHP's APC object cache, which in PHP versions 7.4 up to current 8.2 can be installed using the phpX.X-apc package, significantly improves the execution speed of PHP code and therefore PHP based websites, such as Wordpress. Especially on large Wordpress installations (namely using big plugins such as Woocommerce or WPML) this makes a drastic change of speed.
In most cases it makes sense to install and enable PHP APC by default. There are only a few PHP applications which are known to have problems with the object cache. In such a case, APC can be disabled in that particular FPM pool or in the Apache vhost context (when using mod_php).
With the commands and tools we've used in our troubleshooting analysis (strace, bpftrace, perf and visual Flamegraphs of the process stack) we created helpful evidence and could visually see the differences before and after installing APC.
Pandu Aji from wrote on Sep 4th, 2023:
Thank you for detail instruction about how to get rid with the php-fpm process. When I use bpftrace, i got notified that one of my plugin hit 3582 within 5 second (offload media plugin). After do that, i got normal cpu processing.

AI AWS Android Ansible Apache Apple Atlassian BSD Backup Bash Bluecoat CMS Chef Cloud Coding Consul Containers CouchDB DB DNS Databases Docker ELK Elasticsearch Filebeat FreeBSD Galera Git GlusterFS Grafana Graphics HAProxy HTML Hacks Hardware Icinga Influx Internet Java KVM Kibana Kodi Kubernetes LVM LXC Linux Logstash Mac Macintosh Mail MariaDB Minio MongoDB Monitoring Multimedia MySQL NFS Nagios Network Nginx OSSEC OTRS Observability Office OpenSearch PHP Perl Personal PostgreSQL PowerDNS Proxmox Proxy Python Rancher Rant Redis Roundcube SSL Samba Seafile Security Shell SmartOS Solaris Surveillance Systemd TLS Tomcat Ubuntu Unix VMware Varnish Virtualization Windows Wireless Wordpress Wyse ZFS Znuny Zoneminder