
For several ESX and ESXi servers I'm using the Nagios plugin developped by OP5 called check_esx. It queries the physical host and returns useful information, e.g. CPU, Memory and Network usage. To create rrd-graphics with Nagiosgraph the following map entries need to be done and it will work with your check_esx plugin (note that I renamed it to check_esx3 in my environment):
# Service Type: check_esx3 Disk
# Nagiosgraph regex by Claudio Kuenzler
# Check: check_esx3 -H $HOSTADDRESS$ -u $ARG1$ -p $ARG2$ -l vmfs -s $ARG3$ -w $ARG4$ -c $ARG5$
# Output: CHECK_ESX3 OK - GLDSP-ESX03-LD1 - total: 1426.75 GB - used: 467.05 GB (32.74%) - free: 959.70 GB (67.26%)
# Perfdata: 'GLDSP-ESX03-LD1 used Space'=467.05GB;1284.08;1355.41;0.00;1426.75
/output:CHECK_ESX3.*total: (\d+.\d+) GB.*used: (\d+.\d+) GB.*/
and push @s, [esxdisk,
['total', GAUGE, $1*1000**3 ],
['used', GAUGE, $2*1000**3 ] ];
# Service Type: check_esx3 CPU
# Nagiosgraph regex by Claudio Kuenzler
# Check: check_esx3 -H $HOSTADDRESS$ -u $ARG1$ -p $ARG2$ -l cpu -s usage -w $ARG3$ -c $ARG4$
# Output: CHECK_ESX3 OK - cpu usage=7.74 %
# Perfdata: cpu_usage=7.74%;90;95
/output:CHECK_ESX3.*cpu usage=(\d+.\d+) %/
and push @s, [esxcpu,
['usage', GAUGE, $1 ] ];
# Service Type: check_esx3 Memory
# Nagiosgraph regex by Claudio Kuenzler
# Check: check_esx3 -H $HOSTADDRESS$ -u $ARG1$ -p $ARG2$ -l mem -s usage -w $ARG3$ -c $ARG4$
# Output: CHECK_ESX3 OK - mem usage=44.30 %
# Perfdata: mem_usage=44.30%;90;95
/output:CHECK_ESX3.*mem usage=(\d+.\d+) %/
and push @s, [esxmem,
['usage', GAUGE, $1 ] ];
# Service Type: check_esx3 Network
# Nagiosgraph regex by Claudio Kuenzler
# Check: check_esx3 -H $HOSTADDRESS$ -u $ARG1$ -p $ARG2$ -l net -s usage -w $ARG3$ -c $ARG4$
# Output: CHECK_ESX3 OK - net usage=271.34 KB/s
# Perfdata: net_usage=271.34KB;40000;60000
/output:CHECK_ESX3.*net usage=(\d+.\d+).*/
and push @s, [esxnet,
['usage', GAUGE, $1*1000 ] ];
Add the code above into your nagiosgraph map file (mostly in /etc/nagiosgraph/map or /usr/local/nagiosgraph/etc/map, depends where you installed nagiosgraph).
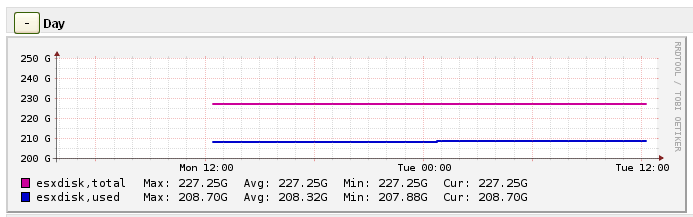
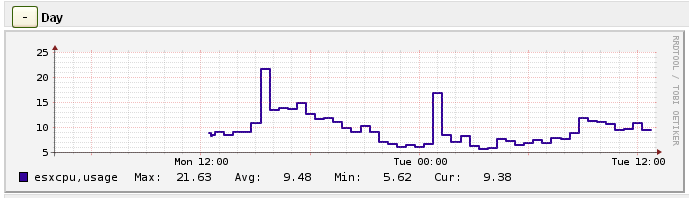
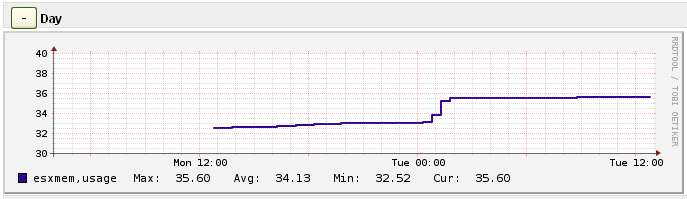
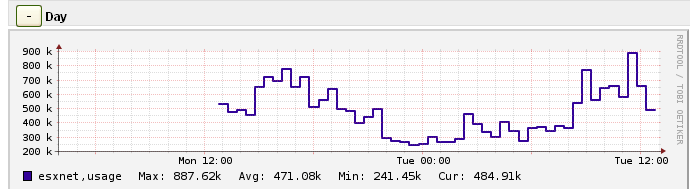
And this is how it'll look:
ck from Switzerland wrote on Mar 21st, 2014:
Hi Perera, it looks like the plugin has changed a lot since I used it. The output is completely different now. Maybe you don't even have to add manual entries to the map file, the perfdata part looks pretty straightforward to me:
v3700_VMSAN-C=95.12%;15:;10:
# Service Type: check_vmware_api.pl Storage
# Nagiosgraph regex by Claudio Kuenzler
# Output: CHECK_VMWARE_API.PL OK - Storages : 'v3700_VMSAN-C'(free)=1440365.00 MB (95.12%)
# Perfdata: v3700_VMSAN-C=95.12%;15:;10:
/perfdata:.*=(\d+.\d+)%;(\d+):;(\d+):/
and push @s, [storage,
['current', GAUGE, $1 ],
['warn', GAUGE, $2 ],
['crit', GAUGE, $3 ]
];
Perera from Sri Lanka wrote on Mar 21st, 2014:
I tried to build the same in my setup but seems graph is not working properly. when I analyse the result of the comment it is not same. Can you please help to correct it. This is the out I get by running /check_vmware_api.pl -H 10.226.2.1 -u root -p holcimesxi -l vmfs -s v3700_VMSAN-C -w "15%:" -c "10%:" command
Output
------
CHECK_VMWARE_API.PL OK - Storages : 'v3700_VMSAN-C'(free)=1440365.00 MB (95.12%) | v3700_VMSAN-C=95.12%;15:;10:
Please help how to build the nagios map entires
Pikiman from PT wrote on Mar 1st, 2012:
Tank you you are the man!!!!
Claudio from CH wrote on Mar 1st, 2012:
In the nagiosgraph map file. You usually find this either in /etc/nagiosgraph/map or /usr/local/nagiosgraph/etc/map - depends where you installed it.
Pikiman from Portugal wrote on Mar 1st, 2012:
Hi, great work. Where to you put this code??? in check_esx3? In nagiosgraph?
Thank You

AI AWS Android Ansible Apache Apple Atlassian BSD Backup Bash Bluecoat CMS Chef Cloud Coding Consul Containers CouchDB DB DNS Databases Docker ELK Elasticsearch Filebeat FreeBSD Galera Git GlusterFS Grafana Graphics HAProxy HTML Hacks Hardware Icinga Influx Internet Java KVM Kibana Kodi Kubernetes LVM LXC Linux Logstash Mac Macintosh Mail MariaDB Minio MongoDB Monitoring Multimedia MySQL NFS Nagios Network Nginx OSSEC OTRS Observability Office OpenSearch PHP Perl Personal PostgreSQL PowerDNS Proxmox Proxy Python Rancher Rant Redis Roundcube SSL Samba Seafile Security Shell SmartOS Solaris Surveillance Systemd TLS Tomcat Ubuntu Unix VMware Varnish Virtualization Windows Wireless Wordpress Wyse ZFS Znuny Zoneminder