
After Grafana was upgraded to 12.0.2 from a previously installed 9.x version, some panels in dashboards showed an error icon.
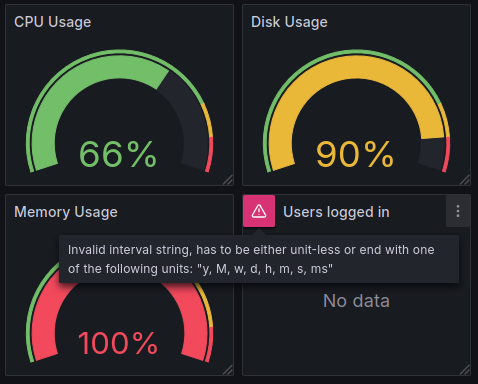
In this particular example, the "Users logged in" panel showed an error icon and "No data". With the mouse hovering over the error icon, the following error message popped up:
Invalid interval string, has to be either unit-less or end with one of the following units: "y, M, w, d, h, m, s, ms"
I first suspected a problem with the "unit" setting of this panel, however it was set to a simple number. Changing the unit did not work either, no data was presented. The panel's (InfluxQL) query was verified multiple times - the fields did not change.
As the error mentioned time units, such as "y, M, w" etc, I also changed the time range at the top right - without a change in the panel.
What am I missing? Did I run into a bug of the new Grafana version?
A research for a particular bug ended indeed in Grafana issue #95320 on GitHub. However after reading through the comments it doesn't look like a bug - but rather an incompatible change in the newer version.
Each panel has so-called "Query options". These options are rarely used and therefore collapsed. By expanding the query options, the different options need to be verified.
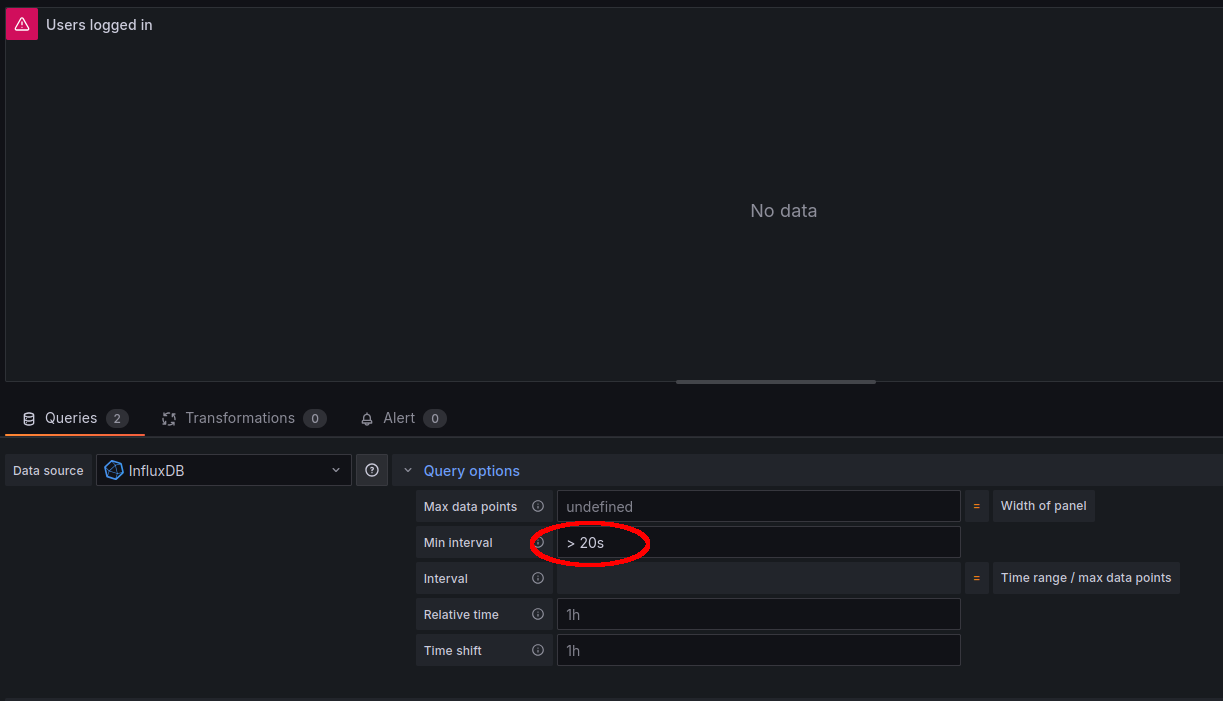
In the case of my "Users logged in" panel, the "Min interval" option was set to a value of "> 20s". This worked in the previously installed Grafana version (9.2.4) but, according to comments in the mentioned issue, stopped working since Grafana 11.6.x.
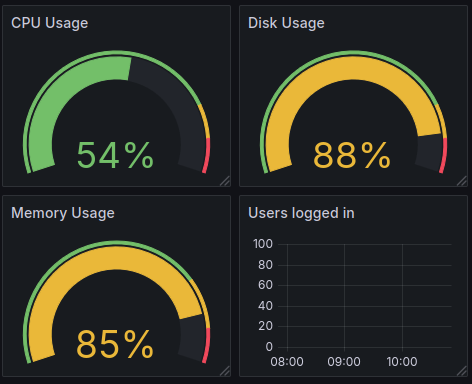
Now with the newest Grafana 12.0.2 installed, I emptied the "Min interval" completely (as it's actually not needed, at least not for this panel) and the data showed up immediately again. The panel is fixed!
With that knowledge added in the back of the head, the panel's previous error message now makes sense, too! The difficult part is just to find the missing link to the query options!
The error comes as kind of a surprise, too. The breaking changes of v11 (on which the error was first reported) and v12 don't mention any major (behaviour) change of the interval units inside the panel query options.
If you were wondering, the screenshots of the four panels above was taken from a managed server dashboard, available for our managed servers customers at Infiniroot. Customers with multiple managed dedicated servers have access to a customized dashboard with live and historic data, showing the performance and usage of the servers. Besides server performance, the dashboards also show application responsiveness, database query spikes, blocked access and much more.
Mike Anderson from Florida wrote on Sep 15th, 2025:
I encountered this issue after upgrading to Grafana 12.0.2. Clearing the 'Min interval' field worked perfectly. Appreciate the detailed guide!
vespaman from wrote on Aug 18th, 2025:
Thanks a lot! I upgraded from 11.6 to 12.1 and had all my panels showing this error. Did not know how to fix this until I read your article above. Saved me a lot of time.

AI AWS Android Ansible Apache Apple Atlassian BSD Backup Bash Bluecoat CMS Chef Cloud Coding Consul Containers CouchDB DB DNS Databases Docker ELK Elasticsearch Filebeat FreeBSD Galera Git GlusterFS Grafana Graphics HAProxy HTML Hacks Hardware Icinga Influx Internet Java KVM Kibana Kodi Kubernetes LVM LXC Linux Logstash Mac Macintosh Mail MariaDB Minio MongoDB Monitoring Multimedia MySQL NFS Nagios Network Nginx OSSEC OTRS Observability Office OpenSearch PHP Perl Personal PostgreSQL PowerDNS Proxmox Proxy Python Rancher Rant Redis Roundcube SSL Samba Seafile Security Shell SmartOS Solaris Surveillance Systemd TLS Tomcat Ubuntu Unix VMware Varnish Virtualization Windows Wireless Wordpress Wyse ZFS Znuny Zoneminder