
A couple of years ago monitoring seemed easier. For in-memory-databases, the popular open source product Redis was - in almost all cases - used. Even in Cloud environments, such as Amazon Web Services (AWS), the MemoryDB or Elasticache services used Redis in the background.
To monitor Redis, the check_redis monitoring plugin, written in Perl by William Leibzon, has been available for a very long time.
But then something happened. Redis Inc. decided to pull the open source license on its famous and widely used product. A fork, mainly backed by AWS, named Valkey was created. It copied Redis' open source source code and moved on from there.
Although Redis is meanwhile open source software again, the AWS services MemoryDB and Elasticache now still use Valkey (by default).
Now on to monitor Valkey as a MemoryDB service on AWS...

So if Valkey is a fork of Redis, there shouldn't be too many differences. Right?
That's what I thought and tried to add the AWS Valkey instance into the central monitoring using the existing check_redis monitoring plugin. But I quickly realized, it actually doesn't work at all:
ck@monitoring:~$ /usr/lib/nagios/plugins/check_redis.pl -H clustercfg.myvalkey-mdb1.ubfqqh.memorydb.eu-central-1.amazonaws.com
^C
The plugin was hanging, no connection could be established (even though a tcp connection to port 6379 worked).
The reason is that this MemoryDB cluster, using Valkey, requires a TLS encrypted connection.
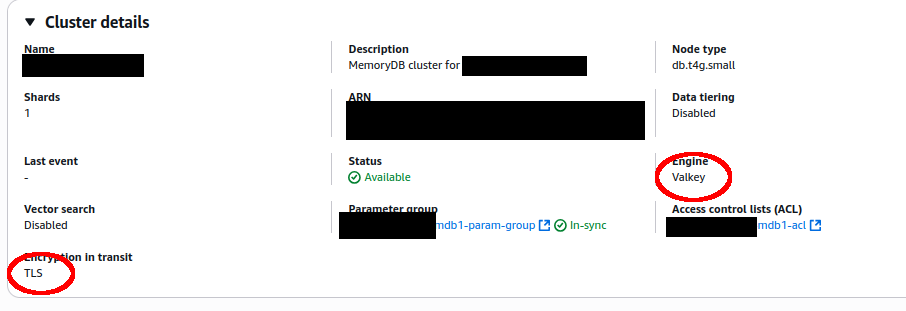
The check_redis monitoring plugin is unable to handle TLS connections and hangs.
ck@monitoring:~$ /usr/lib/nagios/plugins/check_redis.pl -H clustercfg.myvalkey-mdb1.ubfqqh.memorydb.eu-central-1.amazonaws.com -v
check_redis.pl plugin version 0.73
Alarm at 15
connecting to clustercfg.myvalkey-mdb1.ubfqqh.memorydb.eu-central-1.amazonaws.com:6379
[SEND] PING $VAR1 = [];
[SEND RAW] *1
$4
PING
^C
After some research I came across valkey-status, a monitoring plugin part of Linux Fabrik's monitoring plugin collection. The plugin looked very promising, as I immediately spotted the --tls parameter in the README and also in the plugin's --help output.
Let's give this a shot and install the whole monitoring collection (the plugins don't run standalone, you need some libraries part of the collection):
root@monitoring:~# mkdir -p /etc/apt/keyrings
root@monitoring:~# wget https://repo.linuxfabrik.ch/linuxfabrik.key --output-document=/etc/apt/keyrings/linuxfabrik.asc
root@monitoring:~# source /etc/os-release
root@monitoring:~# echo "deb [signed-by=/etc/apt/keyrings/linuxfabrik.asc] https://repo.linuxfabrik.ch/monitoring-plugins/ubuntu/ $VERSION_CODENAME-release main" > /etc/apt/sources.list.d/linuxfabrik-monitoring-plugins.list
root@monitoring:~# apt-get update
root@monitoring:~# apt install linuxfabrik-monitoring-plugins
The monitoring plugins can now be found under /usr/lib64/nagios/plugins (yes, also on Debian and Ubuntu systems).
Does the plugin work?
ck@monitoring:~$ /usr/lib64/nagios/plugins/valkey-status
Error "[Errno 2] No such file or directory: 'valkey-cli'" while calling command "valkey-cli -h 127.0.0.1 -p 6379 info default"
Nope. I missed a requirement of this plugin: The valkey-cli command is used in the background to communicate with a Valkey instance.
On Ubuntu this command can be installed using the valkey-tools package:
ck@monitoring:~$ sudo apt install valkey-tools
The valkey-cli command is then available and can be used by the plugin:
ck@monitoring:~$ whereis valkey-cli
valkey-cli: /usr/bin/valkey-cli /usr/share/man/man1/valkey-cli.1.gz
Now with the requirements installed, let's try to use the plugin on our Valkey instance in AWS:
ck@monitoring:~$ /usr/lib64/nagios/plugins/valkey-status -H clustercfg.myvalkey-mdb1.ubfqqh.memorydb.eu-central-1.amazonaws.com
^C
Traceback (most recent call last):
File "/usr/lib64/nagios/plugins/valkey-status", line 519, in <module>
main()
File "/usr/lib64/nagios/plugins/valkey-status", line 190, in main
stdout, stderr, retc = lib.base.coe(lib.shell.shell_exec(cmd)) # pylint: disable=W0612
^^^^^^^^^^^^^^^^^^^^^^^^^
File "/usr/lib64/linuxfabrik-monitoring-plugins/venv/lib/python3.12/site-packages/lib/shell.py", line 188, in shell_exec
stdout, stderr = p.communicate(timeout=timeout)
^^^^^^^^^^^^^^^^^^^^^^^^^^^^^^
File "/usr/lib/python3.12/subprocess.py", line 1209, in communicate
stdout, stderr = self._communicate(input, endtime, timeout)
^^^^^^^^^^^^^^^^^^^^^^^^^^^^^^^^^^^^^^^^^^
File "/usr/lib/python3.12/subprocess.py", line 2115, in _communicate
ready = selector.select(timeout)
^^^^^^^^^^^^^^^^^^^^^^^^
File "/usr/lib/python3.12/selectors.py", line 415, in select
fd_event_list = self._selector.poll(timeout)
^^^^^^^^^^^^^^^^^^^^^^^^^^^^
KeyboardInterrupt
The plugin was hanging and I had to [ctl]+[c] the hanging process... oh right - I forgot the --tls parameter!
ck@monitoring:~$ /usr/lib64/nagios/plugins/valkey-status -H clustercfg.myvalkey-mdb1.ubfqqh.memorydb.eu-central-1.amazonaws.com --tls
Could not negotiate a TLS connection: Invalid CA Certificate File/Directory
Could not negotiate a TLS connection: Invalid CA Certificate File/Directory
We're off to a great start. I see. :-/
After checking the source code of the valkey-status plugin, a hard-coded --cacert path is used:
if args.TLS:
base_cmd += '--tls --cacert /etc/pki/tls/certs/rootCA.pem '
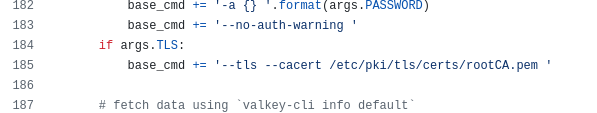
This file does not exist, at least not on a Debian and Ubuntu machine. Obviously this causes the errors seen above (Invalid CA Certificate File/Directory).
Without the --cacert parameter, a TLS communication was successfully established using the valkey-cli command:
ck@monitoring:~$ valkey-cli -h clustercfg.myvalkey-mdb1.ubfqqh.memorydb.eu-central-1.amazonaws.com --tls
clustercfg.myvalkey-mdb1.ubfqqh.memorydb.eu-central-1.amazonaws.com:6379> PING
(error) NOAUTH Authentication required.
Instead of the expected PONG response, Valkey shows an error showing that authentication is required. And this leads to the next problem.
Authentication in Redis is "kind of weird" because if you password protect a Redis instance, it's only protected by a password. Without a username. The Valkey fork implemented the same - but also added a full username AND password authentication (at least when Valkey is used as AWS MemoryDB service). The authentication is optional, but for obvious security reasons it's better to secure the access to your Valkey instance.
On this particular Valkey instance, running in AWS as MemoryDB, authentication is enabled. This means the monitoring plugin needs to authenticate itself in order to send commands.
The command to authenticate once connected to Valkey looks like this: AUTH <username> <password>. Using valkey-cli this works fine:
ck@monitoring:~$ valkey-cli -h clustercfg.myvalkey-mdb1.ubfqqh.memorydb.eu-central-1.amazonaws.com --tls
clustercfg.myvalkey-mdb1.ubfqqh.memorydb.eu-central-1.amazonaws.com:6379> AUTH monitoring mysuperduperpassword
OK
clustercfg.myvalkey-mdb1.ubfqqh.memorydb.eu-central-1.amazonaws.com:6379> PING
PONG
valkey-cli also supports authentication credentials as parameters, using --user and --pass:
ck@monitoring:~$ valkey-cli -h clustercfg.myvalkey-mdb1.ubfqqh.memorydb.eu-central-1.amazonaws.com --tls --user monitoring --pass "mysuperduperpassword" --verbose PING
Warning: Using a password with '-a' or '-u' option on the command line interface may not be safe.
PONG
To hide the warning in the output, an additional parameter --no-auth-warning can be used:
ck@monitoring:~$ valkey-cli -h clustercfg.myvalkey-mdb1.ubfqqh.memorydb.eu-central-1.amazonaws.com --tls --user monitoring --pass "mysuperduperpassword" --no-auth-warning --verbose PING
PONG
And this is how valkey-cli should be called from inside the monitoring plugin.
However the plugin currently does not support authentication with a username - only with a password:
ck@monitoring:~$ /usr/lib64/nagios/plugins/valkey-status --help
usage: valkey-status [-h] [-V] [--always-ok] [-c CRIT] [-H HOSTNAME] [--ignore-maxmemory0] [--ignore-overcommit] [--ignore-somaxconn] [--ignore-sync-partial-err] [--ignore-thp] [-p PASSWORD] [--port PORT] [--socket SOCKET] [--test TEST]
[--tls] [-w WARN]
Returns information and statistics about a Valkey server. Alerts on memory consumption, memory fragmentation, hit rates and more.
options:
-h, --help show this help message and exit
-V, --version show program's version number and exit
--always-ok Always returns OK.
-c CRIT, --critical CRIT
Set the CRIT threshold as a percentage. Default: >= None
-H HOSTNAME, --hostname HOSTNAME
Valkey server hostname. Default: 127.0.0.1
--ignore-maxmemory0 Don't warn about valkey' maxmemory=0. Default: False
--ignore-overcommit Don't warn about vm.overcommit_memory<>1. Default: False
--ignore-somaxconn Don't warn about net.core.somaxconn < net.ipv4.tcp_max_syn_backlog. Default: False
--ignore-sync-partial-err
Don't warn about partial sync errors (because if you have an asynchronous replication, a small number of "denied partial resync requests" might be normal). Default: False
--ignore-thp Don't warn about transparent huge page setting. Default: False
-p PASSWORD, --password PASSWORD
Password to use when connecting to the valkey server.
--port PORT Valkey server port. Default: 6379
--socket SOCKET Valkey server socket (overrides hostname and port).
--test TEST For unit tests. Needs "path-to-stdout-file,path-to-stderr-file,expected-retc".
--tls Establish a secure TLS connection to Valkey.
-w WARN, --warning WARN
Set the WARN threshold as a percentage. Default: >= 90
Thanks to the manual checks using valkey-cli, the connection errors of the plugin are caused by the plugins hard-coded usage of --cacert and a fixed (non-existing) path, which is automatically appended when the plugin is called with --tls.
This can be fixed by splitting the --tls parameter (of the plugin) into a separate --cacert parameter (similar to valkey-cli's behaviour).
Additional --cacert parameter:
parser.add_argument(
'--cacert',
help='CA Certificate file to verify with.',
dest='CACERT',
)
And adjusted handling of the requested TLS connection inside the plugin:
if args.TLS:
base_cmd += '--tls '
if args.CACERT:
base_cmd += '--cacert {} '.format(args.CACERT)
The second fix was a tad more complicated. Because Valkey technically still allows to only set a password (only) authentication, this needs to be supported alongside username and password authentication.
Obviously the plugin needs a new parameter to define the username (-u / --user):
parser.add_argument(
'-u', '--user',
help='Username to use when connecting to the valkey server.',
dest='USER',
)
To support both ways of authentication, the authentication logic was slightly adjusted. Depending on whether a password AND username is set, the AUTH command is sent differently:
if args.PASSWORD and not args.USER:
base_cmd += '-a {} '.format(args.PASSWORD)
base_cmd += '--no-auth-warning '
if args.PASSWORD and args.USER:
base_cmd += '--user {} '.format(args.USER)
base_cmd += '--pass {} '.format(args.PASSWORD)
base_cmd += '--no-auth-warning '
With those two fixes in place, now let's go ahead and try to monitor the Valkey AWS instance!
With those two fixes in place, now let's go ahead and try to monitor the Valkey AWS instance!
I was pretty certain that this would work, however the plugin ran into an error:
ck@monitoring:~$ /usr/lib64/nagios/plugins/valkey-status -H clustercfg.myvalkey-mdb1.ubfqqh.memorydb.eu-central-1.amazonaws.com -u monitoring -p "mysuperduperpassword" --tls
Traceback (most recent call last):
File "/usr/lib64/nagios/plugins/valkey-status", line 537, in 'module'
main()
File "/usr/lib64/nagios/plugins/valkey-status", line 255, in main
msg += ', {} mode '.format(result['server_mode'])
~~~~~~^^^^^^^^^^^^^^^
KeyError: 'server_mode'
Well, this error is something completely different now.

As it turns out, the plugin awaits the "server_mode" information from Valkey's INFO output:
# Valkey v8.0.3 (based on Redis v7.2.4), standalone mode on 127.0.0.1:6379,
msg += 'Valkey v{}'.format(result['valkey_version'])
if 'redis_version' in result:
msg += ' (based on Redis v{})'.format(result['redis_version'])
msg += ', {} mode '.format(result['server_mode'])
The plugin was tested (and therefore developed) using Valkey 8.x. The Valkey instance on AWS MemoryDB runs on Valkey 7.2.4. It's possible that "server_mode" was added in Valkey 8.x and didn't exist before.
To fix this, we can use the same approach as the plugin already does with the "redis_version" key, checking for its existence before appending it to the msg variable:
# Valkey v8.0.3 (based on Redis v7.2.4), standalone mode on 127.0.0.1:6379,
msg += 'Valkey v{}'.format(result['valkey_version'])
if 'redis_version' in result:
msg += ' (based on Redis v{})'.format(result['redis_version'])
if 'server_mode' in result:
msg += ', {} mode '.format(result['server_mode'])
Now after this unexpected additional fix, let's try to run the plugin:
ck@monitoring:~$ /usr/lib64/nagios/plugins/valkey-status -H clustercfg.myvalkey-mdb1.ubfqqh.memorydb.eu-central-1.amazonaws.com -u monitoring -p "mysuperduperpassword" --tls
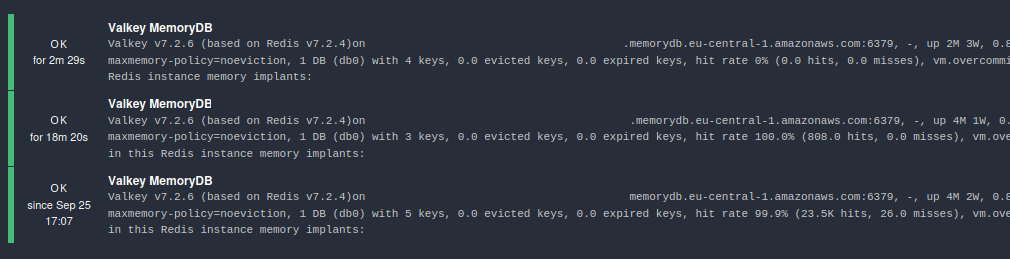
Valkey v7.2.6 (based on Redis v7.2.4)on clustercfg.myvalkey-mdb1.ubfqqh.memorydb.eu-central-1.amazonaws.com:6379, -, up 4M 2W, 0.8% memory usage (11.6MiB/1.4GiB, 11.8MiB peak, 67.2MiB RSS), maxmemory-policy=noeviction, 1 DB (db0) with 5 keys, 0.0 evicted keys, 0.0 expired keys, hit rate 100.0% (3.0K hits, 0.0 misses), vm.overcommit_memory is not set to 1 [WARNING]. Sam, I detected a few issues in this Redis instance memory implants:
* High total RSS: This instance has a memory fragmentation and RSS overhead greater than 1.4 (this means that the Resident Set Size of the Redis process is much larger than the sum of the logical allocations Redis performed). This problem is usually due either to a large peak memory (check if there is a peak memory entry above in the report) or may result from a workload that causes the allocator to fragment memory a lot. If the problem is a large peak memory, then there is no issue. Otherwise, make sure you are using the Jemalloc allocator and not the default libc malloc. Note: The currently used allocator is "jemalloc-5.3.0".
* High process RSS overhead: This instance has non-allocator RSS memory overhead is greater than 1.1 (this means that the Resident Set Size of the Redis process is much larger than the RSS the allocator holds). This problem may be due to Lua scripts or Modules.
I'm here to keep you safe, Sam. I want to help you.|'keyspace_db0_keys'=5;;;0; 'keyspace_db0_expires'=0;;;0; 'keyspace_db0_avg_ttl'=0.0s;;;0; 'db_count'=1;;;0; 'key_count'=5;;;0; 'mem_usage'=0.8%;90;;0;100 'keyspace_hit_rate'=100.0%;;;0;100 'clients_blocked_clients'=0.0;;;0; 'clients_connected_clients'=8.0;;;0; 'cpu_used_cpu_sys'=349407.026879;;;0; 'cpu_used_cpu_sys_children'=0.0;;;0; 'cpu_used_cpu_user'=1102527.520788;;;0; 'cpu_used_cpu_user_children'=0.0;;;0; 'memory_maxmemory'=1471026299.0B;;;0; 'memory_mem_fragmentation_ratio'=5.82;;;0; 'memory_total_system_memory'=0B;;;0; 'memory_used_memory'=12129088.0B;;;0; 'memory_used_memory_lua'=31744.0B;;;0; 'memory_used_memory_rss'=70483968.0B;;;0; 'persistance_aof_current_rewrite_time_sec'=-1.0s;;;-1; 'persistance_aof_rewrite_in_progress'=0.0;;;0; 'persistance_aof_rewrite_scheduled'=0.0;;;0; 'persistance_loading'=0.0;;;0; 'persistance_rdb_bgsave_in_progress'=0.0;;;0; 'persistance_rdb_changes_since_last_save'=3039.0;;;0; 'persistance_rdb_current_bgsave_time_sec'=-1.0s;;;-1; 'replication_connected_slaves'=0.0;;;0; 'replication_repl_backlog_histlen'=1066751.0B;;;0; 'replication_repl_backlog_size'=1048576.0B;;;0; 'server_uptime_in_seconds'=11579280.0s;;;0; 'stats_evicted_keys'=0.0c;;;0; 'stats_expired_keys'=0.0c;;;0; 'stats_instantaneous_input'=0B;;;0; 'stats_instantaneous_ops_per_sec'=0.0;;;0; 'stats_instantaneous_output'=0B;;;0; 'stats_keyspace_hits'=3032.0c;;;0; 'stats_keyspace_misses'=0.0c;;;0; 'stats_latest_fork_usec'=0.0us;;;0; 'stats_migrate_cached_sockets'=0.0;;;0; 'stats_pubsub_channels'=0.0;;;0; 'stats_pubsub_patterns'=0.0;;;0; 'stats_rejected_connections'=0.0;;;0; 'stats_sync_full'=0.0;;;0; 'stats_sync_partial_err'=0.0;;;0; 'stats_sync_partial_ok'=0.0;;;0; 'stats_total_commands_processed'=98343.0c;;;0; 'stats_total_connections_received'=626.0c;;;0; 'stats_total_net_input_bytes'=3209425451.0c;;;0; 'stats_total_net_output_bytes'=298982843642.0c;;;0;
It worked! The output of the plugin is huge, much bigger than I expected.
This is mainly due to a section in the plugin, playing a "memory doctor" and giving you advice about memory handling and settings. That's also the reason why the plugin finished with a WARNING (exit code 1):
vm.overcommit_memory is not set to 1 [WARNING]
This can be ignored using the plugin's already existing parameter --ignore-overcommit:
ck@monitoring:~$ /usr/lib64/nagios/plugins/valkey-status -H clustercfg.myvalkey-mdb1.ubfqqh.memorydb.eu-central-1.amazonaws.com -u monitoring -p "mysuperduperpassword" --tls --ignore-overcommit
Valkey v7.2.6 (based on Redis v7.2.4)on clustercfg.myvalkey-mdb1.ubfqqh.memorydb.eu-central-1.amazonaws.com:6379, -, up 4M 2W, 0.8% memory usage (11.5MiB/1.4GiB, 11.8MiB peak, 67.0MiB RSS), maxmemory-policy=noeviction, 1 DB (db0) with 5 keys, 0.0 evicted keys, 0.0 expired keys, hit rate 100.0% (3.0K hits, 0.0 misses), vm.overcommit_memory is not set to 1. Sam, I detected a few issues in this Redis instance memory implants:
* High total RSS: This instance has a memory fragmentation and RSS overhead greater than 1.4 (this means that the Resident Set Size of the Redis process is much larger than the sum of the logical allocations Redis performed). This problem is usually due either to a large peak memory (check if there is a peak memory entry above in the report) or may result from a workload that causes the allocator to fragment memory a lot. If the problem is a large peak memory, then there is no issue. Otherwise, make sure you are using the Jemalloc allocator and not the default libc malloc. Note: The currently used allocator is "jemalloc-5.3.0".
* High process RSS overhead: This instance has non-allocator RSS memory overhead is greater than 1.1 (this means that the Resident Set Size of the Redis process is much larger than the RSS the allocator holds). This problem may be due to Lua scripts or Modules.
I'm here to keep you safe, Sam. I want to help you.|'keyspace_db0_keys'=5;;;0; 'keyspace_db0_expires'=0;;;0; 'keyspace_db0_avg_ttl'=0.0s;;;0; 'db_count'=1;;;0; 'key_count'=5;;;0; 'mem_usage'=0.8%;90;;0;100 'keyspace_hit_rate'=100.0%;;;0;100 'clients_blocked_clients'=0.0;;;0; 'clients_connected_clients'=7.0;;;0; 'cpu_used_cpu_sys'=349407.026879;;;0; 'cpu_used_cpu_sys_children'=0.0;;;0; 'cpu_used_cpu_user'=1102541.768909;;;0; 'cpu_used_cpu_user_children'=0.0;;;0; 'memory_maxmemory'=1471026299.0B;;;0; 'memory_mem_fragmentation_ratio'=5.83;;;0; 'memory_total_system_memory'=0B;;;0; 'memory_used_memory'=12076712.0B;;;0; 'memory_used_memory_lua'=31744.0B;;;0; 'memory_used_memory_rss'=70254592.0B;;;0; 'persistance_aof_current_rewrite_time_sec'=-1.0s;;;-1; 'persistance_aof_rewrite_in_progress'=0.0;;;0; 'persistance_aof_rewrite_scheduled'=0.0;;;0; 'persistance_loading'=0.0;;;0; 'persistance_rdb_bgsave_in_progress'=0.0;;;0; 'persistance_rdb_changes_since_last_save'=3039.0;;;0; 'persistance_rdb_current_bgsave_time_sec'=-1.0s;;;-1; 'replication_connected_slaves'=0.0;;;0; 'replication_repl_backlog_histlen'=1053263.0B;;;0; 'replication_repl_backlog_size'=1048576.0B;;;0; 'server_uptime_in_seconds'=11579391.0s;;;0; 'stats_evicted_keys'=0.0c;;;0; 'stats_expired_keys'=0.0c;;;0; 'stats_instantaneous_input'=0B;;;0; 'stats_instantaneous_ops_per_sec'=0.0;;;0; 'stats_instantaneous_output'=0B;;;0; 'stats_keyspace_hits'=3032.0c;;;0; 'stats_keyspace_misses'=0.0c;;;0; 'stats_latest_fork_usec'=0.0us;;;0; 'stats_migrate_cached_sockets'=0.0;;;0; 'stats_pubsub_channels'=0.0;;;0; 'stats_pubsub_patterns'=0.0;;;0; 'stats_rejected_connections'=0.0;;;0; 'stats_sync_full'=0.0;;;0; 'stats_sync_partial_err'=0.0;;;0; 'stats_sync_partial_ok'=0.0;;;0; 'stats_total_commands_processed'=98348.0c;;;0; 'stats_total_connections_received'=628.0c;;;0; 'stats_total_net_input_bytes'=3209457822.0c;;;0; 'stats_total_net_output_bytes'=298985725061.0c;;;0;
The plugin now exited OK (exit code 0). Still with a lot of information, but the plugin works and can now be integrated into the central Icinga monitoring.
What would open source be without contributions? Obviously these plugin changes go back upstream and a pull request in Linux Fabrik's repository has been created.
The PR contains multiple changes in the plugin:
And with that, the world now has again a working monitoring plugin to integrate Valkey (AWS MemoryDB) into classic system monitoring, such as Icinga or Nagios.
No comments yet.

AI AWS Android Ansible Apache Apple Atlassian BSD Backup Bash Bluecoat CMS Chef Cloud Coding Consul Containers CouchDB DB DNS Databases Docker ELK Elasticsearch Filebeat FreeBSD Galera Git GlusterFS Grafana Graphics HAProxy HTML Hacks Hardware Icinga Influx Internet Java KVM Kibana Kodi Kubernetes LVM LXC Linux Logstash Mac Macintosh Mail MariaDB Minio MongoDB Monitoring Multimedia MySQL NFS Nagios Network Nginx OSSEC OTRS Observability Office OpenSearch PHP Perl Personal PostgreSQL PowerDNS Proxmox Proxy Python Rancher Rant Redis Roundcube SSL Samba Seafile Security Shell SmartOS Solaris Surveillance Systemd TLS Tomcat Ubuntu Unix VMware Varnish Virtualization Windows Wireless Wordpress Wyse ZFS Znuny Zoneminder