
I recently experienced problem in VMware vSphere client where the performance graphics/statistics graphs were not shown anymore.
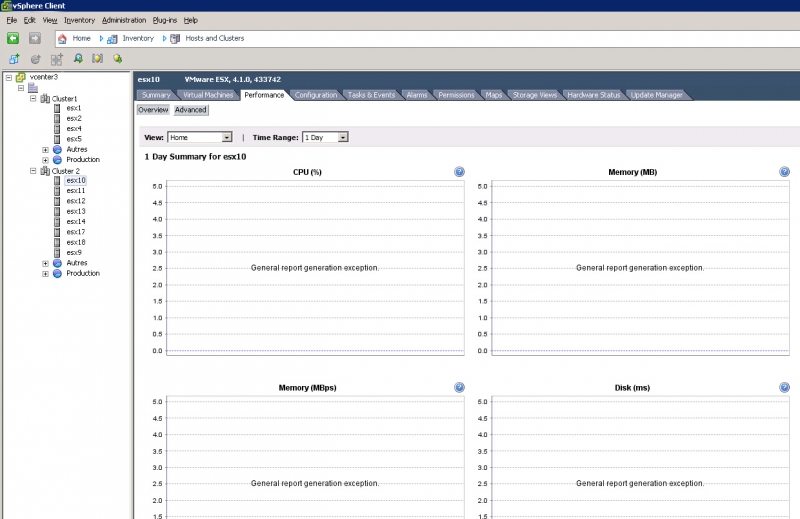
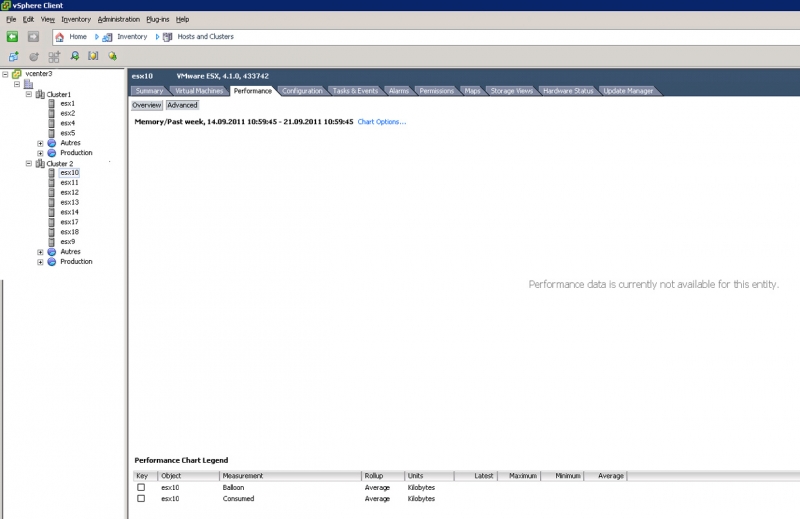
The overview didn't show anything, except of an error 'General report generation exception'. In the advanced tab only the real-time statistics could be seen, everything else (Past Day, Week, etc.) just showed the error 'Performance data is currently not available for this entity.'.
Take a look at the screenshots:
There are several workarounds which can be found in the VMware Knowledge Base, but depending on the source of the problem, several of them can be skipped and more than one of them need to be applied. In my case I had to apply several. Let's start with it:
1) According to VMware KB 1004382, this problem occurs, when the SQL jobs are not correctly configured or if they run with errors. The SQL jobs have to be deleted and recreated by following the steps in the KB entry.
2) The SQL jobs and Procedures should be verified by following VMware KB 1029824.
3) Another approach is to reset the statistic options in the vCenter settings. In vSphere client click on Administration → vCenter Server Settings… In the new window, click on Statistics on the left navigation side. Select the different intervals and change the Statistics Level to another number:
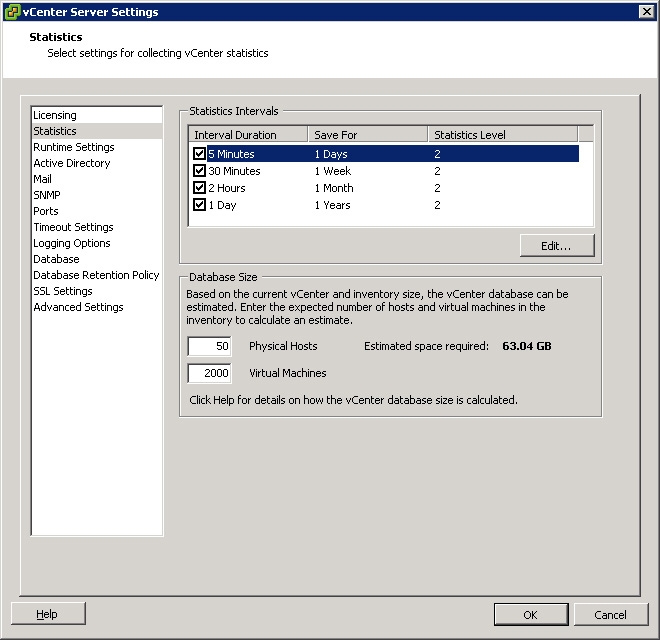
After applying these 3 steps, the SQL jobs started to run at their scheduled time and the advanced performance graphs were shown again. However the Overview graphics were still not shown and still showed the error mentioned above.
To resolve this issue I had to dig deeper: The table views in the MSSQL database need to be recreated (not only the jobs as we did in step 1, but the whole tables). You will lose historical performance data by doing this (but as you can't see them anyway you don't mind). We add a forth step:
4) Follow VMware KB 1015606. After applying the steps of this KB entry, the missing overview graphs could be resolved and are showing again.
No comments yet.

AI AWS Android Ansible Apache Apple Atlassian BSD Backup Bash Bluecoat CMS Chef Cloud Coding Consul Containers CouchDB DB DNS Databases Docker ELK Elasticsearch Filebeat FreeBSD Galera Git GlusterFS Grafana Graphics HAProxy HTML Hacks Hardware Icinga Influx Internet Java KVM Kibana Kodi Kubernetes LVM LXC Linux Logstash Mac Macintosh Mail MariaDB Minio MongoDB Monitoring Multimedia MySQL NFS Nagios Network Nginx OSSEC OTRS Observability Office OpenSearch PHP Perl Personal PostgreSQL PowerDNS Proxmox Proxy Python Rancher Rant Redis Roundcube SSL Samba Seafile Security Shell SmartOS Solaris Surveillance Systemd TLS Tomcat Ubuntu Unix VMware Varnish Virtualization Windows Wireless Wordpress Wyse ZFS Znuny Zoneminder