
On Terminal Servers or Citrix servers the remote connection sessions are inevitable important. Therefore it is strongly recommend the number of the sessions, not only for licensing purposes but also to be aware when users don't log off their sessions correctly (and for other reasons of course).
To monitor the current active sessions, there is already a plugin for Nagios which is called 'Count number of terminal server sessions'. This plugin (actually a Windows batch file) uses the command 'query session' to find users which have an active RDP-Session (found by rdp-tcp#).
Unfortunately, this plugin doesn't output performance data and every Nagios administrator loves the graphs. But don't worry, it's very easy to add this. Another additional information I wanted to know through the plugin was not only the number of active connections, but also the number of disconnected sessions. Citrix admins might know that problematic....
As I mentioned, the plugin looks by default for the sessions with 'rdp-tcp#' mentioned. By changing this to 'ica-tcp#', Citrix sessions can be found as well.
So here we go, this is the modified plugin:
@ECHO OFF
SET /a COUNTA=0
SET /a COUNTD=0
FOR /f "TOKENS=1 DELIMS= " %%G IN ('query session ^|find "ica-tcp#"') DO SET /a COUNTA+=1
FOR /f "TOKENS=1 DELIMS= " %%G IN ('query session ^|find "Disc"') DO SET /a COUNTD+=1
ECHO Active sessions = %COUNTA%, Disconnected Sessions = %COUNTD%^|usersconnected=%COUNTA%;usersdisconnected=%COUNTD%
exit 0
To explain it's function in some words:
First two variables are defined, COUNTA (which represents the number of Active sessions) and COUNTD (for the number of Disconnected sessions).
Twice the command 'query session' is executed. The 'find' (equivalent to grep on Linux) looks for opened ICA (Citrix) sessions. These are all marked with 'ica-tcp#'.
The second query session looks for the string 'Disc' which marks disconnected sessions.
For each entry found, the defined variables COUNTA and COUNTD are incremented by one.
At the end follows the output (echo), followed by the pipe which represents the performance data to create graphs.
And this is how the graphs look like:
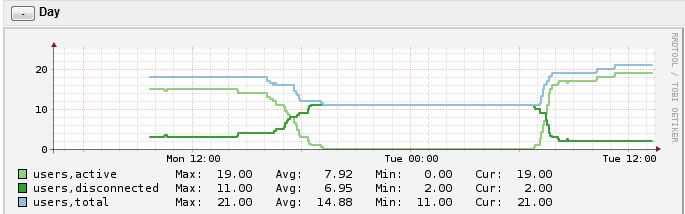
Believe it or not, this is exactly why I needed the graphs. To prove that the Citrix users didn't do a correct logoff, but rather disconnected their session ;-).
Credits go to the developer of the original plugin, briandent. You may also download my modified version here: check_user_count.bat
ck from Switzerland wrote on Oct 24th, 2014:
Hi JeeSee. I personally do not use PNP4Nagios but I am quite sure that you have to adapt or create a PNP4Nagios template to make it show the graphs you want.
JeeSee from wrote on Oct 24th, 2014:
Thanx for this great script! I got it working under Nagios now for all of our Citrix Servers. I got one question:
How to get the right performance data for Nagios in PNP4Nagios?
When I look in PNP4Nagios, I only get a graph for the Connected Users, Not the Disconnected Users. Is it possible to get statistics for Disconnected Users, like your here above in PNP4Nagios?
Claudio from Switzerland wrote on Feb 17th, 2014:
Ciao Gabriele. Unfortunately I don't use or know Cacti, sorry.
Gabriele from IT wrote on Feb 17th, 2014:
Nice script!
Please, can you tell me how to read this output from cacti Debian server?

AI AWS Android Ansible Apache Apple Atlassian BSD Backup Bash Bluecoat CMS Chef Cloud Coding Consul Containers CouchDB DB DNS Databases Docker ELK Elasticsearch Filebeat FreeBSD Galera Git GlusterFS Grafana Graphics HAProxy HTML Hacks Hardware Icinga Influx Internet Java KVM Kibana Kodi Kubernetes LVM LXC Linux Logstash Mac Macintosh Mail MariaDB Minio MongoDB Monitoring Multimedia MySQL NFS Nagios Network Nginx OSSEC OTRS Observability Office OpenSearch PHP Perl Personal PostgreSQL PowerDNS Proxmox Proxy Python Rancher Rant Redis Roundcube SSL Samba Seafile Security Shell SmartOS Solaris Surveillance Systemd TLS Tomcat Ubuntu Unix VMware Varnish Virtualization Windows Wireless Wordpress Wyse ZFS Znuny Zoneminder