
If someone is following the Nagios user mailing list, one might have seen my today's solution on a problem with Nagiosgraph. It all started with the question of James Osbourn, why the graph in Nagiosgraph was not showing the real values for a disk check.
My first answer was to use the following map entry:
/perfdata:(.*)=(\d+)MB;(\d+);(
\d+);(\d+);(\d+).*/
and push @s, [diskusage,
['used', GAUGE, $2*1000**2 ],
['total', GAUGE, $6*1000**2 ] ];
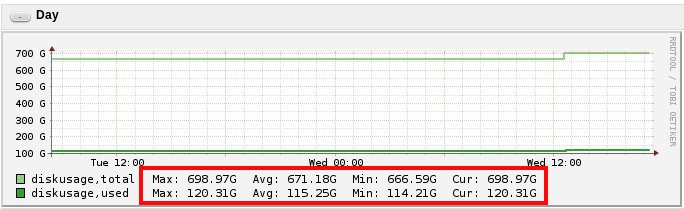
But after a closer look, I saw that this graph was also not correct. For some reason I stuck with this map entry for some years now. It must have been a workaround to create graphs which were closer to the real disk values, because by multiplying the values with 1024 the values were way off:
So I started shooting the trouble (troubleshooting). =)
I took a file system output and wanted to see how this is being handled:
Filesystem 1K-blocks Used Available Use% Mounted on
/dev/md4 682587992 117493996 530693544 19% /
Filesystem Size Used Avail Use% Mounted on
/dev/md4 651G 113G 507G 19% /
df shows a value in KB (682587992).
The Nagios plugin itself takes this value and presents it in MB (666589):
/=114709MB;533271;599930;0;666589
So in order to present Nagiosgraph the values, we have to go down to the lowest level, which in this case is Byte.
To get Byte value from the Nagios output we have to multiply it with 1024^2: 666589*1024*1024 = 698969227264
The job of Nagiosgraph is now to take this 698969227264 value and divide it so often through 1024 until a "reasonable" and human readable value is given, which would be the 651 GB.
But here's the problem: Nagiosgraph divides 698969227264 through 1000 instead of 1024, showing the graph at 698 GB.
But why? It took me some guesses which I had to confirm but: Nagiosgraph BY DEFAULT divides through 1000. Probably because the initial reason for rrd graphs was the graphing of network connections which are usually in bits. Anyhow we need to tell Nagiosgraph to divide through 1024 for our disk checks.
There's a special file for that called rrdopts.conf. I added the following lines to it:
# disk values need to be divided by 1024 not 1000
Diskspace /=-b 1024
Root Partition=-b 1024
The string left defines the service description in Nagios. So in my case this is "Diskspace /". -b 1024 tells Nagiosgraph to take 1024 as a base value.
See the following entry from the "rrdgraph" manpage:
[-b|--base value]
If you are graphing memory (and NOT network traffic) this switch should be set to 1024 so that one Kb is 1024 byte. For traffic measurement, 1 kb/s is 1000 b/s.
Now you just have to make sure, that rrdopts.conf is not commented in your nagiosgraph.conf file and there you go.
Positive thing is that there is no need to recreate the rrd files, this rrd option is only for viewing/drawing the graphs.
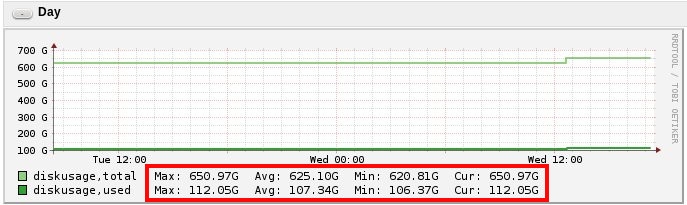
Which means that the correct values are shown immediately, which is proven after a refresh of the Nagiosgraph page:
No comments yet.

AI AWS Android Ansible Apache Apple Atlassian BSD Backup Bash Bluecoat CMS Chef Cloud Coding Consul Containers CouchDB DB DNS Databases Docker ELK Elasticsearch Filebeat FreeBSD Galera Git GlusterFS Grafana Graphics HAProxy HTML Hacks Hardware Icinga Influx Internet Java KVM Kibana Kodi Kubernetes LVM LXC Linux Logstash Mac Macintosh Mail MariaDB Minio MongoDB Monitoring Multimedia MySQL NFS Nagios Network Nginx OSSEC OTRS Observability Office OpenSearch PHP Perl Personal PostgreSQL PowerDNS Proxmox Proxy Python Rancher Rant Redis Roundcube SSL Samba Seafile Security Shell SmartOS Solaris Surveillance Systemd TLS Tomcat Ubuntu Unix VMware Varnish Virtualization Windows Wireless Wordpress Wyse ZFS Znuny Zoneminder