
At work we're not only having temperature sensors in the data center, but also outside of it. This is not only very important for climate control but it's also nice to have a very accurate information about the current temperature outside - and its fun to see how the temperatures change within hours, day, weeks...
The past month, July 2013, felt very hot - at least for Swiss standards. But did we only feel it, or was it really much warmer than usual?
The following graph shows the temperature curve from 2nd of July (in week 27) until 6th of August (week 32):
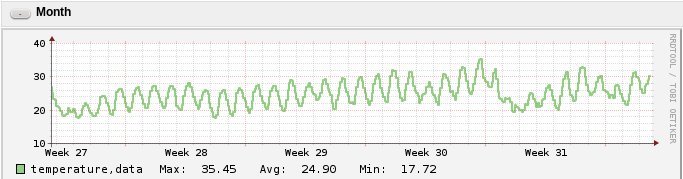
The hottest day was on the 27th of July - it was around 36° Celsius.
But more interesting is actually the average temperature over a whole month: 24.90 degrees! Don't forget, that average also counts in all the nights...
According to Wikipedia's entry of Zurich Switzerland, the "normal" average temperature in whole July should be 18.9°:
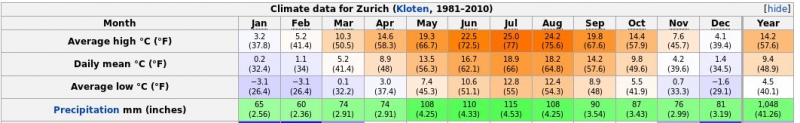
(Source Wikipedia/MeteoSwiss)
... meaning that this July 2013 was 6 degrees warmer than usual.
No comments yet.

AI AWS Android Ansible Apache Apple Atlassian BSD Backup Bash Bluecoat CMS Chef Cloud Coding Consul Containers CouchDB DB DNS Databases Docker ELK Elasticsearch Filebeat FreeBSD Galera Git GlusterFS Grafana Graphics HAProxy HTML Hacks Hardware Icinga Influx Internet Java KVM Kibana Kodi Kubernetes LVM LXC Linux Logstash Mac Macintosh Mail MariaDB Minio MongoDB Monitoring Multimedia MySQL NFS Nagios Network Nginx OSSEC OTRS Observability Office OpenSearch PHP Perl Personal PostgreSQL PowerDNS Proxmox Proxy Python Rancher Rant Redis Roundcube SSL Samba Seafile Security Shell SmartOS Solaris Surveillance Systemd TLS Tomcat Ubuntu Unix VMware Varnish Virtualization Windows Wireless Wordpress Wyse ZFS Znuny Zoneminder