
Whenever I had to check a web server in the past, I used the check_http Nagios plugin, which, well, does the job. No website shown = Problem.
This works fine on classical web server setups, but in the past months I have built more and more proxied web solutions. As reverse proxy I tend to use Nginx for speed and "smallness".
Instead of checking a website/URL on the Nginx reverse proxy, it makes more sense to actually check the Nginx status and retrieve the live status data from Nginx. Like Apache, Nginx has an embedded "server status" feature, which can be activated like this:
server {
listen 80 default_server;
[...]
location /nginx_status {
stub_status on;
access_log off;
allow 127.0.0.1;
allow 192.168.45.43;
deny all;
}
}
Note that I'm using the "default server" for the nginx status here. To do that in a virtual host server wouldn't make much sense.
The output of this status looks like this:
curl http://127.0.0.1/nginx_status
Active connections: 2
server accepts handled requests
31302 31302 58730
Reading: 0 Writing: 1 Waiting: 1
This week I came across check_nginx_status.pl which is easy to understand, simply works, and outputs performance data gathered from the Nginx status page.
A requirement is of course, that the IP address of the server on which check_nginx_status.pl is launched, is allowed to access the status page. That's why I added "allow 192.168.45.43;" into the Nginx config. Yes, you guessed correct - that's my Nagios server. You may of course also launch the plugin on the same host as Nginx and use the plugin through NRPE but I prefer to do all checks from a remote site, if possible.
Let's take a look what the plugin is doing:
./check_nginx_status.pl -H mynginx.example.com
NGINX OK - 0.031 sec. response time, Active: 3 (Writing: 1 Reading: 0 Waiting: 2) ReqPerSec: 0.250 ConnPerSec: 0.250 ReqPerConn: 1.556|Writing=1;;;; Reading=0;;;; Waiting=2;;;; Active=3;;;; ReqPerSec=0.250000;;;; ConnPerSec=0.250000;;;; ReqPerConn=1.556139;;;;
Of course the plugin also supports thresholds:
./check_nginx_status.pl -H mynginx.example.com -w 10000,100,200 -c 20000,200,300
NGINX OK - 0.031 sec. response time, Active: 2 (Writing: 1 Reading: 0 Waiting: 1) ReqPerSec: 0.067 ConnPerSec: 0.067 ReqPerConn: 1.556|Writing=1;;;; Reading=0;;;; Waiting=1;;;; Active=2;;;; ReqPerSec=0.066667;;;; ConnPerSec=0.066667;;;; ReqPerConn=1.555996;;;;
Unfortunately the thresholds are not (yet) represented in the performance output. But hey, the plugin is on github, so development is open for everyone!
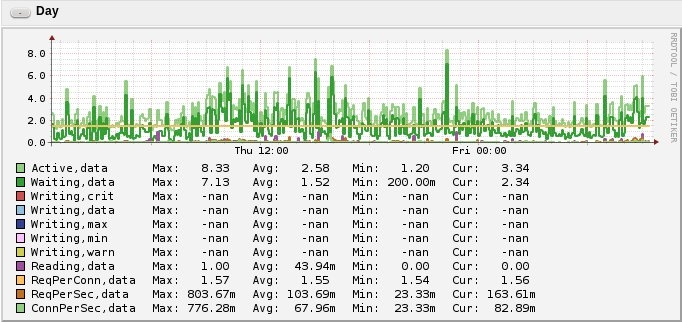
And this is how the graphs look in Nagiosgraph:
And for a reverse proxy with more traffic:
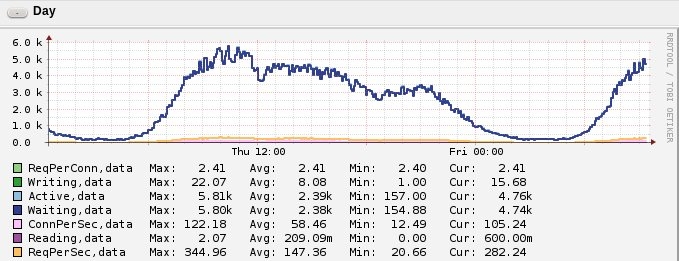
To sum this all up: check_nginx_status.pl is definitely a better way to check an Nginx reverse proxy than if I'd use check_http. It also gives performance data which are then shown in the graphs. These graphs can then be quickly verified for troubleshooting reasons, e.g. to see if a DDOS occurs.
Deepanjan from india wrote on May 23rd, 2018:
i have installed Nagios XI and i want to monitor my webserver which use nginx service
How to configure so that i can monitor nginx from my NagiosXi server
Thanks in Advance
ck from Switzerland wrote on Mar 2nd, 2017:
Luv, you usually save monitoring plugins (check_nginx_status.pl is such a monitoring plugin) in the folder /usr/lib/nagios/plugins (Debian, Ubuntu, SuSE) or /usr/lib64/nagios/plugins (Centos, RHEL) or /usr/local/nagios/libexec (self-compiled) or wherever you have saved the other monitoring plugins.
Luv from wrote on Mar 2nd, 2017:
Where to store this check_nginx_status.pl file ?

AI AWS Android Ansible Apache Apple Atlassian BSD Backup Bash Bluecoat CMS Chef Cloud Coding Consul Containers CouchDB DB DNS Databases Docker ELK Elasticsearch Filebeat FreeBSD Galera Git GlusterFS Grafana Graphics HAProxy HTML Hacks Hardware Icinga Influx Internet Java KVM Kibana Kodi Kubernetes LVM LXC Linux Logstash Mac Macintosh Mail MariaDB Minio MongoDB Monitoring Multimedia MySQL NFS Nagios Network Nginx OSSEC OTRS Observability Office OpenSearch PHP Perl Personal PostgreSQL PowerDNS Proxmox Proxy Python Rancher Rant Redis Roundcube SSL Samba Seafile Security Shell SmartOS Solaris Surveillance Systemd TLS Tomcat Ubuntu Unix VMware Varnish Virtualization Windows Wireless Wordpress Wyse ZFS Znuny Zoneminder