
For more than a year now I've been successfully monitoring SmartOS smartmachines with Nagios. To monitor the memory usage, I am using check_mem which works very well and allows me to create graphics (the perfdata code of this plugin was actually added by me).
Here an example of the graph:
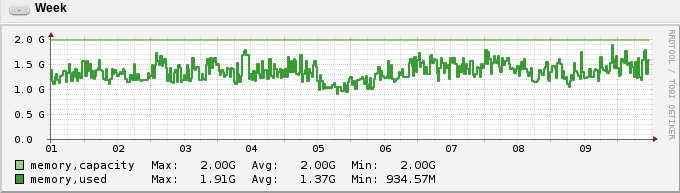
While this is working on smartmachines (the zones), the plugin does not work on physical servers.
To get the currently used memory value, the command kstat is used. If I launch the command on a physical (global zone) SmartOS, all zones are shown:
kstat -pc zone_memory_cap :::rss :::physcap
memory_cap:0:global:rss 0
memory_cap:1:57fc3d3a-5e64-4d04-bfb8-150521:rss 65212416
memory_cap:2:fd631bd1-bd33-41fa-9dcb-22b560:rss 320839680
memory_cap:3:e9490a97-1de4-4454-baa7-3f5c3e:rss 55779328
memory_cap:4:f6f05a1f-0f04-45a4-96dd-0006d0:rss 244248576
memory_cap:5:290fc8d8-6e6a-414b-967d-0a185d:rss 61616128
memory_cap:6:f2d169d8-20d2-41d4-8e43-8a9fc5:rss 2195832832
[...]
This would be OK - but the global zone's rss value is 0 (see above). So I started looking for alternatives, how to get the actual usage of the global zone.
One good alternative I found, was to use mdb:
echo ::memstat | mdb -k
Page Summary Pages MB %Tot
------------ ---------------- ---------------- ----
Kernel 11406904 44558 34%
ZFS File Data 12069177 47145 36%
Anon 8802319 34384 26%
Exec and libs 12085 47 0%
Page cache 25488 99 0%
Free (cachelist) 12979 50 0%
Free (freelist) 1220564 4767 4%
Total 33549516 131052
Physical 33549514 131052
There are some downsides of this command, though: The command takes nearly 4 seconds for the output (I can live with that) and I am not sure if the sum of the percentage correct. Sure, they sum up to 100% and I know that ZFS uses a lot of memory, but 36% of the whole system? But at least this is a working alternative.
Another way I found is to use prstat which in combination with -Z shows a summary of the zones. With -z a zone id can be used to retrieve the data for a specific zone:
prstat -z 0 -Z
PID USERNAME SIZE RSS STATE PRI NICE TIME CPU PROCESS/NLWP
95 root 0K 0K sleep 99 -20 55:03:33 0.1% zpool-zones/182
87597 root 22M 18M sleep 59 0 1:34:22 0.0% perl/1
87596 root 24M 17M sleep 59 0 0:34:56 0.0% perl/1
3622 root 32M 27M sleep 59 0 8:43:10 0.0% node/6
3913 root 55M 35M sleep 100 - 5:38:20 0.0% node/5
6022 root 17M 13M sleep 59 0 3:37:54 0.0% vmadmd/6
3927 root 1936K 1344K sleep 1 0 0:00:00 0.0% ttymon/1
4144 root 6688K 3144K sleep 29 0 0:00:00 0.0% inetd/3
3824 root 1936K 1344K sleep 1 0 0:00:00 0.0% ttymon/1
62 root 2572K 1448K sleep 29 0 0:00:04 0.0% pfexecd/3
1531 root 12M 8200K sleep 29 0 0:19:40 0.0% nscd/31
3920 root 1936K 1344K sleep 1 0 0:00:00 0.0% ttymon/1
27 root 3100K 1636K sleep 29 0 0:00:16 0.0% dlmgmtd/14
30 netadm 4500K 2748K sleep 29 0 0:00:07 0.0% ipmgmtd/3
589 root 6640K 2812K sleep 29 0 0:00:00 0.0% syseventd/18
ZONEID NPROC SWAP RSS MEMORY TIME CPU ZONE
0 80 986M 651M 0.4% 86:36:28 0.1% global
Total: 80 processes, 557 lwps, load averages: 1.61, 1.68, 1.80
The interesting part comes after the process list. The column RSS is the amount of memory used by the global zone.
As prstat is an interactive command (like top on Linux), you have to play around with it a little to be able to save the output into a file:
prstat -z 0 -Z 1 1 > output.txt
I have now different options to patch the "check_mem" plugin for SmartOS:
When doing a calculation of the different methods, the results vary:
kstat mem rss (sum): 34189 MB = 33.39 GB
memstat/mdb kernel: 44898 MB = 43.85 GB
prstat rss (sum): 34659 MB = 33.85 GB
Joyent sdc used RAM: 37376 MB = 36.5 GB
So the closest result to the one from SDC is the sum of all prstat rss values. If I subtract the global zone's rss value I get the same rss value as from kstat. So that seems correct.
Whatever method I will decide for, the result will be pushed upsteam into the Voxer Nagios-Plugins repository.
ck from Switzerland wrote on Feb 24th, 2016:
Hi UX-Admin. Maybe in your point of view. But if you sell zones to your customers (and that's the case in that setup), you need to know their memory usage in order to generate correct invoices.
EDIT: Oh, I misunderstood your comment. Yes, on the global zone it might be wrong, however we needed at least some graph in our monitoring to understand the memory consumption on a physical level. We never got to the point where this is 100% accurate, but it gave us an idea.
Luckily we ditched SmartOS after a while (it was too much of a headache with customer requests).
UX-admin from wrote on Feb 24th, 2016:
The global zone keeps track of the entire system's memory usage, and all zones share that same memory. Therefore, keeping track of each individual zone's aggregate memory usage is pointless, not to mention incorrect. If you however have zones whose processes are leaking memory, then the indivdual process which is leaking memory should be tracked down and debugged. What you are attempting to do is really unnecessary.

AI AWS Android Ansible Apache Apple Atlassian BSD Backup Bash Bluecoat CMS Chef Cloud Coding Consul Containers CouchDB DB DNS Databases Docker ELK Elasticsearch Filebeat FreeBSD Galera Git GlusterFS Grafana Graphics HAProxy HTML Hacks Hardware Icinga Influx Internet Java KVM Kibana Kodi Kubernetes LVM LXC Linux Logstash Mac Macintosh Mail MariaDB Minio MongoDB Monitoring Multimedia MySQL NFS Nagios Network Nginx OSSEC OTRS Observability Office OpenSearch PHP Perl Personal PostgreSQL PowerDNS Proxmox Proxy Python Rancher Rant Redis Roundcube SSL Samba Seafile Security Shell SmartOS Solaris Surveillance Systemd TLS Tomcat Ubuntu Unix VMware Varnish Virtualization Windows Wireless Wordpress Wyse ZFS Znuny Zoneminder