
A couple of days ago it occurred to me that check_smart didn't correctly create graphs for the defect list performance data. I would have wanted to have a graph which shows the increasing number of defect blocks/sectors over time.
The newest version 4.2 allows the correct graphing and also correctly displays the critical threshold in the graph if the -b parameter was used.
You can find the plugin here: Nagios Plugins / check_smart plugin to monitor HDD SMART values.
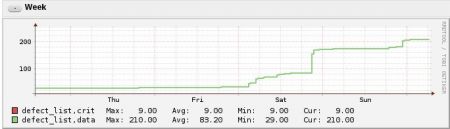
The following graph shows the increasing number of defect entries over a short period of time. Such graphing might help indicate a failing disk:
No comments yet.

AI AWS Android Ansible Apache Apple Atlassian BSD Backup Bash Bluecoat CMS Chef Cloud Coding Consul Containers CouchDB DB DNS Databases Docker ELK Elasticsearch Filebeat FreeBSD Galera Git GlusterFS Grafana Graphics HAProxy HTML Hacks Hardware Icinga Influx Internet Java KVM Kibana Kodi Kubernetes LVM LXC Linux Logstash Mac Macintosh Mail MariaDB Minio MongoDB Monitoring Multimedia MySQL NFS Nagios Network Nginx OSSEC OTRS Observability Office OpenSearch PHP Perl Personal PostgreSQL PowerDNS Proxmox Proxy Python Rancher Rant Redis Roundcube SSL Samba Seafile Security Shell SmartOS Solaris Surveillance Systemd TLS Tomcat Ubuntu Unix VMware Varnish Virtualization Windows Wireless Wordpress Wyse ZFS Znuny Zoneminder