
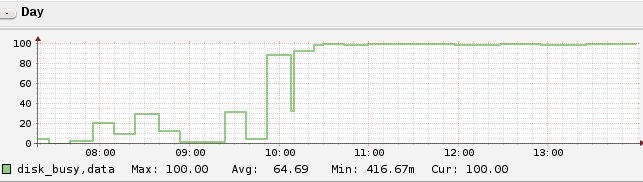
On a physical server, running SmartOS, I got an alert of high disk utilization. I monitor this this with the "disk busy" plugin from Voxer. The graph is clearly showing that the disk is fully used:
On the physical SmartOS node, I tried to find the zone causing this huge I/O load, first with iostat....
iostat 1 10
tty lofi1 ramdisk1 sd0 nfs1 cpu
tin tout kps tps serv kps tps serv kps tps serv kps tps serv us sy wt id
0 2 0 0 1 1 0 0 4431 9 20 2 0 4 1 4 0 95
0 3179 0 0 0 0 0 0 4746 133 75 0 0 0 1 3 0 95
0 81 0 0 0 0 0 0 8008 565 16 0 0 0 2 6 0 93
0 81 0 0 0 0 0 0 6857 304 32 0 0 0 1 6 0 93
0 81 0 0 0 0 0 0 5371 265 37 0 0 0 1 4 0 94
0 81 0 0 0 0 0 0 6205 136 74 0 0 0 1 3 0 96
0 3018 0 0 0 0 0 0 8033 245 39 0 0 0 2 4 0 95
0 81 0 0 0 0 0 0 23729 1048 9 0 0 0 1 8 0 90
0 83 0 0 0 0 0 0 6528 265 31 90 4 2 2 7 0 91
0 81 0 0 0 0 0 0 13951 917 9 0 0 0 1 8 0 91
... and then with "iosnoop", a dtrace wrapper script written by Brendan Gregg:
./iosnoop.sh
UID PID D BLOCK SIZE COMM PATHNAME
80 93605 R 64 20480 nginx /zones/cd60b29f-e22d-49f5-9d15-2f480487dce9/root/mounts/cms/ftp/2393.jpg
0 95 W 3943224164 8192 zpool-zones
0 95 W 2210793451 8192 zpool-zones
0 95 W 2210793475 8192 zpool-zones
0 95 W 2210793499 8192 zpool-zones
0 95 W 2210793523 8192 zpool-zones
0 95 W 2210793547 8192 zpool-zones
0 95 W 2210793571 8192 zpool-zones
0 95 W 2210793595 8192 zpool-zones
0 95 W 2210793812 8192 zpool-zones
0 95 W 2210793836 8192 zpool-zones
0 95 W 2210794628 8192 zpool-zones
0 95 W 2210794721 8192 zpool-zones
0 95 W 2210794745 8192 zpool-zones
0 95 W 2210794785 8192 zpool-zones
0 95 W 2210797360 8192 zpool-zones
0 38826 R 3357461065 512 chef-client
0 95 W 2210797384 8192 zpool-zones
0 95 W 2210798416 8192 zpool-zones
[...]
So almost all of the write (W) operations were done by the process "zpool-zones" - which at that point I didn't understand why the zpool process would cause so much write I/O.
On my research I came across an issue on the github repository of zfsonlinux, someone who had seen the same symptoms.
The user CadieuxK used the following dtrace command to see the real path and the number of times a write operation happened:
dtrace -n 'syscall::*write:entry {@[execname, fds[arg0].fi_pathname] = sum (arg2);}'
php
qemu-system-x86_ /zones/1361e201-2db6-4582-91f5-2b7cf0c1a1e7/root/dev/zvol/rdsk/zones/1361e201-2db6-4582-91f5-2b7cf0c1a1e7-disk0 2347008
qemu-system-x86_ /zones/1361e201-2db6-4582-91f5-2b7cf0c1a1e7/root/dev/zvol/rdsk/zones/1361e201-2db6-4582-91f5-2b7cf0c1a1e7-disk1 2646016
pkgin
qemu-system-x86_ /zones/312f8c17-fa72-41ab-be82-8306e0e799b4/root/dev/zvol/rdsk/zones/312f8c17-fa72-41ab-be82-8306e0e799b4-disk0 7434240
qemu-system-x86_
qemu-system-x86_ /zones/312f8c17-fa72-41ab-be82-8306e0e799b4/root/dev/zvol/rdsk/zones/312f8c17-fa72-41ab-be82-8306e0e799b4-disk1 23785472
So the last entry had 23785472 write operations during the time I ran the dtrace command. WOAH!
The zone with the ID 312f8c17-fa72-41ab-be82-8306e0e799b4 is actually a KVM and not a zone, that's why I couldn't see any helpful information in the iosnoop output before.
Once logged in on this KVM machine (a CentOS 6.4), I ran iostat to verify the local writes:
iostat 10
Linux 2.6.32-358.14.1.el6.x86_64 (linux) 04/30/2014 _x86_64_ (2 CPU)
avg-cpu: %user %nice %system %iowait %steal %idle
0.86 5.79 7.77 55.31 0.00 30.28
Device: tps Blk_read/s Blk_wrtn/s Blk_read Blk_wrtn
vda 7.10 0.80 351.20 8 3512
vdb 122.30 1112.00 1836.00 11120 18360
dm-0 44.00 0.80 351.20 8 3512
dm-1 0.00 0.00 0.00 0 0
dm-2 39.20 1065.60 130.40 10656 1304
dm-3 1.80 0.00 14.40 0 144
dm-4 213.70 20.00 1694.40 200 16944
Almost all write operations happen on dm-4... Let's check out what LV this is:
ll /dev/mapper/
total 0
crw-rw---- 1 root root 10, 58 Sep 12 2013 control
lrwxrwxrwx 1 root root 7 Sep 12 2013 vg_atmail-lv_root -> ../dm-0
lrwxrwxrwx 1 root root 7 Sep 12 2013 vg_atmail-lv_swap -> ../dm-1
lrwxrwxrwx 1 root root 7 Sep 12 2013 vg_data-lv_log -> ../dm-3
lrwxrwxrwx 1 root root 7 Sep 12 2013 vg_data-lv_mysql -> ../dm-4
lrwxrwxrwx 1 root root 7 Sep 12 2013 vg_data-lv_users -> ../dm-2
MySQL! After checking out the processlist it turned out, that another administrator was doing some "debugging" work on this CentOS server, causing such a huge disk I/O that even the physical server (and all zones and kvm's running on it) suffered. After the processes were killed (and the other admin beaten), the IOPS went back to normal:
avg-cpu: %user %nice %system %iowait %steal %idle
0.76 0.00 0.86 0.05 0.00 98.32
Device: tps Blk_read/s Blk_wrtn/s Blk_read Blk_wrtn
vda 4.50 0.00 73.60 0 736
vdb 0.40 0.00 7.20 0 72
dm-0 9.20 0.00 73.60 0 736
dm-1 0.00 0.00 0.00 0 0
dm-2 0.00 0.00 0.00 0 0
dm-3 0.90 0.00 7.20 0 72
dm-4 0.00 0.00 0.00 0 0
On the physical SmartOS server I launched the previous dtrace command again to verify less disk i/o:
dtrace -n 'syscall::*write:entry {@[execname, fds[arg0].fi_pathname] = sum (arg2);}'
[...]
qemu-system-x86_ /zones/312f8c17-fa72-41ab-be82-8306e0e799b4/root/dev/zvol/rdsk/zones/312f8c17-fa72-41ab-be82-8306e0e799b4-disk0 3657728
This time there were 3657728 write operations (I have let the dtrace command run for more or less, but not the exact same time) but the difference is still enormous:
23785472 before vs. 3657728 after (6.5 times less)
And the disk busy graph is happy again, too:
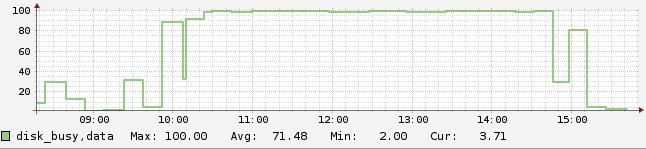
No comments yet.

AI AWS Android Ansible Apache Apple Atlassian BSD Backup Bash Bluecoat CMS Chef Cloud Coding Consul Containers CouchDB DB DNS Databases Docker ELK Elasticsearch Filebeat FreeBSD Galera Git GlusterFS Grafana Graphics HAProxy HTML Hacks Hardware Icinga Influx Internet Java KVM Kibana Kodi Kubernetes LVM LXC Linux Logstash Mac Macintosh Mail MariaDB Minio MongoDB Monitoring Multimedia MySQL NFS Nagios Network Nginx OSSEC OTRS Observability Office OpenSearch PHP Perl Personal PostgreSQL PowerDNS Proxmox Proxy Python Rancher Rant Redis Roundcube SSL Samba Seafile Security Shell SmartOS Solaris Surveillance Systemd TLS Tomcat Ubuntu Unix VMware Varnish Virtualization Windows Wireless Wordpress Wyse ZFS Znuny Zoneminder