
Nagiosgraph has been and still is a graphing tool for Nagios and Icinga. I've been using it for nearly 10 years now and although the presentation of the graphs is nowadays outdated (compared to other interfaces like Kibana), the possibility to create own regex rules in its "map" configuration lets you specify a specific graph for special plugins. While I am slowly migrating several monitoring systems from Icinga 1 to Icinga 2, I became aware that Nagiosgraph isn't working with Icinga 2 - at least not out of the box. However in an Icinga blog entry from December 2012 it is mentioned:
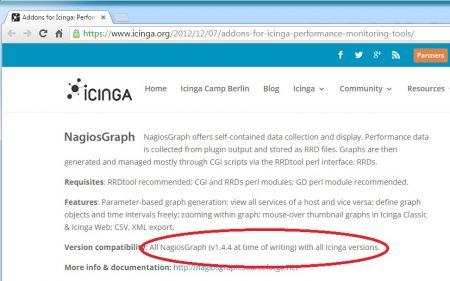
Version compatibility: All NagiosGraph (v1.4.4 at time of writing) with all Icinga versions.
It's true that Nagiosgraph is working fine with Icinga 1, but not with Icinga 2. Only after a few manual changes here and there, Nagiosgraph will work with Icinga 2.
And this is what this article is about: Make Nagiosgraph work with Icinga 2.
But first of all it's important to understand how performance data works in Nagios/Icinga 1 before we go fiddling around in the Icinga 2 installation.
How performance data is working in Nagios/Icinga 1
In the general config file (nagios.cfg or icinga.cfg), Nagios/Icinga 1 is tought to enable performance data (process_performance_data) and where to write that performance data (service_perdata_file).
Another config option defines how the format of the performance data should look like (service_perfdata_file_template). The format is very important so Nagiosgraph is able to correctly parse the information line by line.
The service_perfdata_processing_command config option tells Nagios/Icinga 1 which command to run when the performance data are processed.
process_performance_data=1
service_perfdata_file=/var/nagiosgraph/perfdata.log
service_perfdata_file_template=$LASTSERVICECHECK$||$HOSTNAME$||$SERVICEDESC$||$SERVICEOUTPUT$||$SERVICEPERFDATA$
service_perfdata_file_mode=a
service_perfdata_file_processing_interval=30
service_perfdata_file_processing_command=process-service-perfdata
The "process-service-perfdata" command itself is typically defined in commands.cfg:
# 'process-service-perfdata' command definition NAGIOSGRAPH
define command {
command_name process-service-perfdata
command_line /usr/lib/nagios/plugins/insert.pl
}
With the above configurations, Nagios/Icinga 1 writes the performance data into the log file /var/nagiosgraph/perfdata.log and every 30 seconds, the perl script "/usr/lib/nagios/plugins/insert.pl" is launched.
This insert.pl is the "data importer" script, from the point of view of Nagiosgraph. It parses the perfdata.log file and creates or updates rrd files.
How performance data is working in Icinga 2
(My Icinga 2 experience (spring 2015) isn't as wide as my Nagios/Icinga 1 experience (starting 2005) so please correct me if I misunderstood something or am missing important information.)
In Icinga 2, performance data is not configured in the "core" itself anymore, it's placed into a separate module (called feature in Icinga 2 terminology) and is named "perfdata".
The configuration of this feature is in /etc/icinga2/features-enabled/perfdata and contains by default one PerfdataWriter object.
This feature, if enabled, will write the performance data into the following default locations:
- A temporary file for host performance data: /var/spool/icinga2/tmp/host-perfdata
- A temporary file for service performance data: /var/spool/icinga2/tmp/service-perfdata
- The final log file for host performance data: /var/spool/icinga2/perfdata/host-perfdata
- The final log file for service performance data: /var/spool/icinga2/perfdata/service-perfdata
Icinga 2 writes the performance data into the temporary files for host and service performance data and then moves the data from the temporary files into the final log files.
Additionally to this, Icinga 2 rotates the final log files every now and then (default is every 30 seconds). This means that every 30 seconds the final log files will be renamed with a suffix of the current timestamp.
The performance data format itself "Defaults to a template that's suitable for use with PNP4Nagios.", which means it looks this way:
service_format_template = "DATATYPE::SERVICEPERFDATA\tTIMET::$icinga.timet$\tHOSTNAME::$host.name$\tSERVICEDESC::$service.name$\tSERVICEPERFDATA::$service.perfdata$\tSERVICECHECKCOMMAND::$service.check_command$\tHOSTSTATE::$host.state$\tHOSTSTATETYPE::$host.state_type$\tSERVICESTATE::$service.state$\tSERVICESTATETYPE::$service.state_type$"
The actual output of the service perfdata log file will then look like this:
DATATYPE::SERVICEPERFDATA TIMET::1446543217 HOSTNAME::linux1 SERVICEDESC::CPU Load SERVICEPERFDATA::load1=0.000;4.500;6.000;0; load5=0.010;4.000;5.500;0; load15=0.050;3.500;5.000;0; SERVICECHECKCOMMAND::nrpe HOSTSTATE::UP HOSTSTATETYPE::HARD SERVICESTATE::OK SERVICESTATETYPE::HARD
This information can also be found in the official Icinga 2 documentation.
The Nagiosgraph problem with Icinga 2
There are several problems, when I try to integrate Nagiosgraph into Icinga2. Definitely the main problem is that Icinga 2 rotates the perfdata log files which causes a rename of the perfdata log file. Nagiosgraph is only able to handle one single file which is defined in nagiosgraph.conf. If the rotation could be disabled, the file name would stay the same and Nagiosgraph would be able to work. In hope that this will someday be implemented, I created a feature request: https://dev.icinga.org/issues/10520.
Another problem is that the default performance data output, as written in the documentation, is formatted to be parsed by PNP4Nagios. Nagiosgraph doesn't know how to handle the format of these lines and is unable to parse the data.
And yet another problem I hit was whenever Nagiosgraph successfully parses the perfdata log file, it deletes it afterwards. One would think that Icinga 2 simply recreates a new perfdata log file, but that's not the case. Icinga 2 holds on to the original inode of the log file and if its gone, it does not recreate the file. In my eyes that's a bug and I created a bug report on https://dev.icinga.org/issues/10523.
But to all these problems there are workarounds and now we finally come to the most relevant part:
How to integrate Nagiosgraph in Icinga 2
Let's start from scratch and install Nagiosgraph from source. Download the latest Nagiosgraph version (as of this writing in November 2015 it's 1.5.2) and unpack it into a temporary location.
nagiosgraphversion=1.5.2
mkdir /tmp/nagiosgraph
wget -O /tmp/nagiosgraph/nagiosgraph-${nagiosgraphversion}.tar.gz http://downloads.sourceforge.net/project/nagiosgraph/nagiosgraph/${nagiosgraphversion}/nagiosgraph-${nagiosgraphversion}.tar.gz
cd /tmp/nagiosgraph
tar -xvzf nagiosgraph-${nagiosgraphversion}.tar.gz
cd nagiosgraph-${nagiosgraphversion}/
Check the prerequirments, if there are any requirments missing. In my case the optional perl modules failed, but they're optional so I continued:
./install.pl --check-prereq
checking required PERL modules
Carp...1.29
CGI...3.63
Data::Dumper...2.145
Digest::MD5...2.52
File::Basename...2.84
File::Find...1.23
MIME::Base64...3.13
POSIX...1.32
RRDs...1.4007
Time::HiRes...1.9725
checking optional PERL modules
GD... ***FAIL***
Nagios::Config... ***FAIL***
checking nagios installation
nagios not found in any of:
/usr/bin
/usr/sbin
/bin
/sbin
/usr/local/nagios3/bin
/usr/local/nagios2/bin
/usr/local/nagios/bin
/usr/local/icinga/bin
/opt/nagios3/bin
/opt/nagios2/bin
/opt/nagios/bin
/opt/icinga/bin
checking web server installation
found apache executable at /usr/sbin/apache2
found apache init script at /etc/init.d/apache2
*** one or more problems were detected!
In my setup I wanted to run nagiosgraph in /var/nagiosgraph. So I prepared the following folders:
test -d /var/nagiosgraph || mkdir /var/nagiosgraph
test -d /var/nagiosgraph/etc || mkdir /var/nagiosgraph/etc
test -d /var/nagiosgraph/rrd || mkdir /var/nagiosgraph/rrd
Now copy all configuration files to the new destination (/var/nagiosgraph/etc):
cp etc/* /var/nagiosgraph/etc/
By default the scripts use /opt/nagiosgraph in their library definition. Adapt the path in cgi and perl files. I simply use a sed command to replace /opt with /var:
sed -i '/use lib/s/opt/var/' cgi/*.cgi
sed -i '/use lib/s/opt/var/' lib/insert.pl
Then copy the rest of the nagiosgraph files into the correct destination folders.
That's easier said than done, because Icinga 2 (installed through a package) is spread into a lot of paths on the system.
insert.pl (the "perfdata importer script") is copied into the classical nagios-plugins folder:
cp lib/insert.pl /usr/lib/nagios/plugins/
The cgi files of Icinga 2, or better said icinga2-classicui, are stored in /usr/lib/cgi-bin/icinga/:
cp cgi/*.cgi /usr/lib/cgi-bin/icinga/
The css stylesheets are located in /etc/icinga/stylesheets/:
cp share/nagiosgraph.css /etc/icinga/stylesheets/
And the javascript files are located in /usr/share/icinga/htdocs/js:
cp share/nagiosgraph.js /usr/share/icinga/htdocs/js/
Yes, I agree; it's quite confusing.
Now adapt nagiosgraph.conf to use correct paths. The following variables must be corrected:
# Location of nagios performance data log file.
#perflog = /var/nagios/perfdata.log
perflog = /var/spool/icinga2/perfdata/nagiosgraph-perfdata
# File containing regular expressions to identify service and perf data
#mapfile = /etc/nagiosgraph/map
mapfile = /var/nagiosgraph/etc/map
# Nagiosgraph CGI URL.
#nagiosgraphcgiurl = /nagiosgraph/cgi-bin
nagiosgraphcgiurl = /cgi-bin/icinga2-classicui
# JavaScript: URL to the nagiosgraph javascript file.
#javascript = /nagiosgraph/nagiosgraph.js
javascript = /icinga2-classicui/js/nagiosgraph.js
# Stylesheet: URL to the nagiosgraph stylesheet.
#stylesheet = /nagiosgraph/nagiosgraph.css
stylesheet = /icinga2-classicui/stylesheets/nagiosgraph.css
The following settings in nagiosgraph.conf are optional. I just document this for the sake of reminding myself.
- rrdoptsfile will be used to fix the bit vs. byte calculation.
- heartbeat is increased to a high value to be able to graph checks which have a high check_period setting.
# Optional - define rrdopts override file, this enables you to specify
# particular rrdgraph options against each service.
rrdoptsfile=/var/nagiosgraph/etc/rrdopts.conf
# RRD heartbeat, in seconds. This defines the maximum length of an interval
# with no data update before rrd considers the data unknown. Typically twice
# the size of servicecheck interval. 600 is the rrdtool default.
#heartbeat = 600
heartbeat = 7500
Then adapt the permissions (Icinga 2 runs as nagios user):
chown -R nagios:nagios /var/nagiosgraph; chmod 775 /var/nagiosgraph/rrd
touch /var/nagiosgraph/nagiosgraph.log; chown nagios:nagios /var/nagiosgraph/nagiosgraph.log
touch /var/nagiosgraph/nagiosgraph-cgi.log; chown www-data:www-data /var/nagiosgraph/nagiosgraph-cgi.log; chmod 664 /var/nagiosgraph/nagiosgraph-cgi.log
Now it's time to configure Icinga 2's perfdata module/feature.
For Nagiosgraph, I added a new PerfdataWriter object in /etc/icinga2/features-enabled/perfdata.conf:
object PerfdataWriter "nagiosgraph" {
host_temp_path = "/var/spool/icinga2/perfdata/nagiosgraph-host-perfdata"
service_temp_path = "/var/spool/icinga2/perfdata/nagiosgraph-perfdata"
host_perfdata_path = "/var/spool/icinga2/perfdata/nagiosgraph-host-perfdata"
service_perfdata_path = "/var/spool/icinga2/perfdata/nagiosgraph-perfdata"
host_format_template = "$icinga.timet$||$host.name$||$host.name$||$host.output$||$host.perfdata$"
service_format_template = "$icinga.timet$||$host.name$||$service.name$||$service.output$||$service.perfdata$"
rotation_interval = 1d
}
Let me explain this PerdataWriter object, called nagiosgraph, for you.
As you can see, the temp paths and the final log paths for host and service performance data are the same. After a lot of testing I figured out if the paths (temp and final) are the same, there is no renaming of the log file happening during an Icinga 2 restart.
Also I increased the rotation_interval to 1 day (or basically to a high value) so Icinga 2 doesn't rename the final log file every 30 seconds (which is the default).
Very important: The format template configuration! Are you recognizing the Nagiosgraph format here? Good eyes! ;)
So with this PerfdataWriter object we have solved the first two problems:
- The rotation does not happen anymore (or at least not for a long time) so Nagiosgraph is able to parse the same file over and over again.
- The output format of the performance data is now compatible with Nagiosgraph.
But what about the problem that Nagiosgraph deletes the perfdata logfile after parsing it? For this a manual "fix" of Nagiosgraph is necessary.
The Nagiosgraph functions are all defined in one central file: /var/nagiosgraph/etc/ngshared.pm. The function responsible for reading the perfdata log file is called "readperfdata". I adapted the function that it does not delete (unlink) the parsed logfile at the end but instead renames it back to the original filename ($fn) and simply empties it. See here the full function:
### 20151103 Claudio Kuenzler: Dont delete perfdata file after parsing (Icinga 2 compatibility)
### perflog = /var/spool/icinga2/perfdata/nagiosgraph-perfdata
## read data from the perflog
sub readperfdata {
my ($fn) = @_;
debug(DBDEB, 'readperfdata(' . $fn . ')');
my @lines;
if (-s $fn) {
my $worklog = $fn . '.nagiosgraph';
if (! rename $fn, $worklog) {
debug(DBCRT, "cannot process perflog: rename failed for $fn");
return @lines;
}
if (open my $PERFLOG, '<', $worklog) {
while (<$PERFLOG>) {
push @lines, $_;
}
close $PERFLOG or debug(DBERR, "close failed for $worklog: $OS_ERROR");
# 20151103 Claudio Kuenzler: Do not delete the file, just rename it back and empty it
rename $worklog, $fn;
open my $fn, '>', $fn or die "Could not open file '$fn' $!";
print $fn "\n";
close $fn;
} else {
debug(DBWRN, "cannot read perfdata from $worklog: $OS_ERROR");
return @lines;
}
}
if (not @lines) {
debug(DBINF, 'empty perflog ' . $fn);
} else {
debug(DBINF, 'read ' . scalar @lines . ' lines from perflog');
}
return @lines;
}
If bug https://dev.icinga.org/issues/10523 gets fixed then this hack in ngshared.pm shouldn't be necessary anymore. But for now you have to live with this workaround.
Now finally you can do the honor and launch the insert.pl script as nagios user:
/usr/lib/nagios/plugins/insert.pl
Follow the Nagiosgraph logfile (/var/nagiosgraph/nagiosgraph.log) to look for errors. If something doesn't work correctly you should activate "debug_insert" in nagiosgraph.conf.
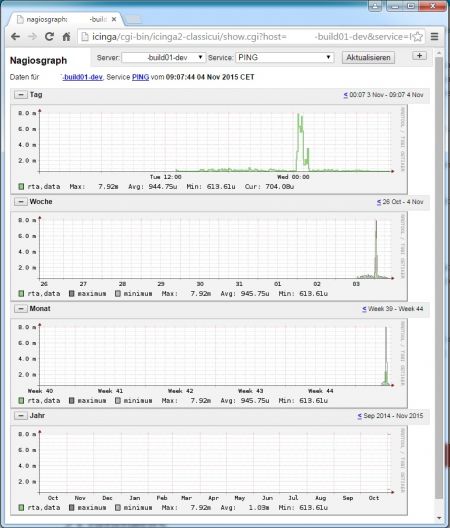
If everything worked you should be able to see graphs on http://myicingainstallation/cgi-bin/icinga2-classicui/show.cgi.
Congratulations! Now all what's missing is an automatic run of insert.pl which you can set up as cronjob for the nagios user:
crontab -l -u nagios
# m h dom mon dow command
*/1 * * * * /usr/lib/nagios/plugins/insert.pl
Update November 5th 2015
Turns out that whenever Icinga 2 is restarted or the config reloaded, the rotation happens anyway. Which then breaks again the single file for nagiosgraph. I really hope that the feature request mentioned above will be considered. As another workaround I have now set up the following:
1. Created /var/spool/icinga2/nagiosgraph folder to have a separate path of the default /var/spool/icinga2/perfdata folder:
mkdir /var/spool/icinga2/nagiosgraph; chown nagios:nagios /var/spool/icinga2/nagiosgraph
2. Adapted the nagiosgraph PerfdataWriter object in /etc/icinga2/features-enabled/perfdata.conf:
object PerfdataWriter "nagiosgraph" {
host_temp_path = "/var/spool/icinga2/tmp/nagiosgraph-host-perfdata"
service_temp_path = "/var/spool/icinga2/tmp/nagiosgraph-perfdata"
host_perfdata_path = "/var/spool/icinga2/nagiosgraph/nagiosgraph-host-perfdata"
service_perfdata_path = "/var/spool/icinga2/nagiosgraph/nagiosgraph-perfdata"
host_format_template = "$icinga.timet$||$host.name$||$service.name$||$service.output$||$host.perfdata$\n"
service_format_template = "$icinga.timet$||$host.name$||$service.name$||$service.output$||$service.perfdata$"
rotation_interval = 15s
}
3. Created a new script in /etc/icinga2/scripts/nagiosgraph-perfdata.sh:
#!/bin/bash
# special script to handle nagiosgraph performance data in icinga 2
# author: claudio kuenzler
# history:
# 20151105: Create script
# 20151123: Add "-exec ls -tr {} +" at the end of find command
########################################################################
perfdatadir=/var/spool/icinga2/nagiosgraph
# find all rotated files (ending with a timestamp) and output into a single file
for file in $(find $perfdatadir/ -type f -regex ".*[0-9]" -exec ls -tr {} +); do
#echo $file
cat $file >> /tmp/nagiosgraph-perfdata
rm $file
done
# now launch nagiosgraph's insert.pl
/usr/lib/nagios/plugins/insert.pl
exit 0
4. Adapted /var/nagiosgraph/etc/nagiosgraph.conf to search the perflog in /tmp:
perflog = /tmp/nagiosgraph-perfdata
5. Instead of directly launching insert.pl, launch the new created nagiosgraph-perfdata.sh script as cronjob:
crontab -l -u nagios
*/1 * * * * /etc/icinga2/scripts/nagiosgraph-perfdata.sh
With this setup all perfdata log files which were rotated by Icinga 2 are taken in consideration and are appended into one single file (/tmp/nagiosgraph-perfdata) which is then read by nagiosgraph's insert.pl. Due to the modifications in ngshared.pm the file will be emptied every time it was parsed by nagiosgraph.
No comments yet.

AI AWS Android Ansible Apache Apple Atlassian BSD Backup Bash Bluecoat CMS Chef Cloud Coding Consul Containers CouchDB DB DNS Databases Docker ELK Elasticsearch Filebeat FreeBSD Galera Git GlusterFS Grafana Graphics HAProxy HTML Hacks Hardware Icinga Influx Internet Java KVM Kibana Kodi Kubernetes LVM LXC Linux Logstash Mac Macintosh Mail MariaDB Minio MongoDB Monitoring Multimedia MySQL NFS Nagios Network Nginx OSSEC OTRS Observability Office OpenSearch PHP Perl Personal PostgreSQL PowerDNS Proxmox Proxy Python Rancher Rant Redis Roundcube SSL Samba Seafile Security Shell SmartOS Solaris Surveillance Systemd TLS Tomcat Ubuntu Unix VMware Varnish Virtualization Windows Wireless Wordpress Wyse ZFS Znuny Zoneminder