
Since my early Nagios days (2005), I've used Nagiosgraph as my graphing service of choice. But in the last few years, other technologies came up. PNP4Nagios has became the de facto graphing standard for Nagios and Icinga installations. On big setups with several hundreds of hosts and thousands of services this is a wise choice; PNP4Nagios is a lot faster than Nagiosgraph. But Nagiosgraph can be more easily adapted to create custom graphs using the "map" file. That's why I ran PNP4Nagios and Nagiosgraph in parallel for the last few years on my Icinga 2 installation.
The main reason why I couldn't get rid of Nagiosgraph were performance data which were retrieved by plugins executed through check_nrpe. For example the monitoring plugin check_netio:
$ /usr/lib/nagios/plugins/check_nrpe -H remotehost -c check_netio -a eth0
NETIO OK - eth0: RX=2849414346, TX=1809023474|NET_eth0_RX=2849414346B;;;; NET_eth0_TX=1809023474B;;;;
The plugin reads the RX and TX values from the ifconfig command. As we know, these are counter values; a value which starts from 0 (at boot time) and increases with the number of Bytes passed through that interface.
While a check_disk through NRPE gives correct graphs in PNP4Nagios, the mentioned check_netio didn't:
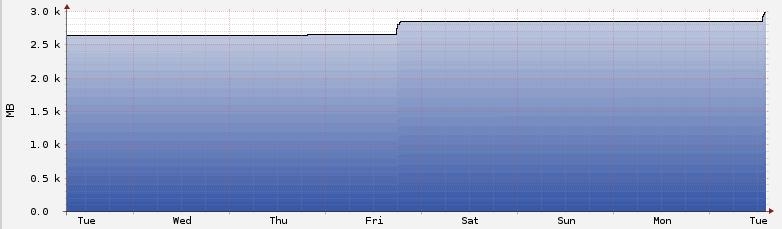
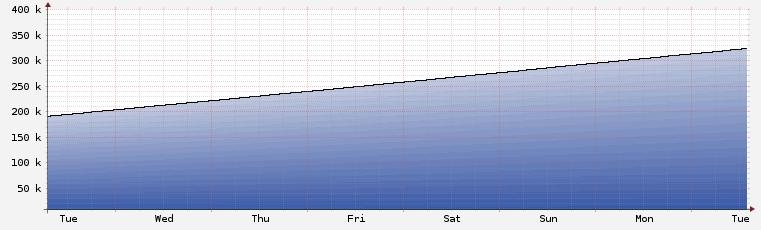
The first graph on top shows the values from a check_disk plugin. The second graph below represents the values from the check_netio plugin. Both plugins were executed through NRPE on the remote host.
The comparison between the two graphs shows pretty clearly that only unique values (GAUGE in RRD terms; a good example: temperature) are working correctly. The counter values are shown with their increasing value instead of the difference between two values to determine the change.
Where does this come from? Why does PNP4Nagios doesn't reflect these values correctly? The problem can be found in the communication between Icinga 2 and PNP4Nagios.
Each time a host or service is checked in Icinga 2, the perfdata feature writes the performance data log file - by default in /var/spool/icinga2/perfdata. Inside such a log file Icinga 2 shows the following information:
$ cat /var/spool/icinga2/perfdata/service-perfdata*
[...]
DATATYPE::SERVICEPERFDATA TIMET::1483441246 HOSTNAME::remotehost SERVICEDESC::Network IO eth0 SERVICEPERFDATA::NET_eth0_RX=2316977534837B;;;; NET_eth0_TX=41612087322B;;;; SERVICECHECKCOMMAND::nrpe HOSTSTATE::UP HOSTSTATETYPE::HARD SERVICESTATE::OK SERVICESTATETYPE::HARD
[...]
Take a closer look at the variable SERVICECHECKCOMMAND and you now see that it only contains nrpe - for each remote plugin executed through NRPE, whether this is check_disk, check_netio, check_ntp or whatever.
So Icinga 2 feeds this infromation to poor PNP4Nagios, which of course thinks all the checks are the same (nrpe) and handle all the graphs exactly the same (GAUGE by default). Which explains why the graphs for plugins with COUNTER results fail.
In order to tell PNP4Nagios that we're running different kinds of plugins and values behind NRPE, Icinga 2's PerfdataWriter needs to be adapted a little bit. I edited the default PerfdataWriter object called "perfdata":
$ cat /etc/icinga2/features-enabled/perfdata.conf
object PerfdataWriter "perfdata" {
service_format_template = "DATATYPE::SERVICEPERFDATA\tTIMET::$icinga.timet$\tHOSTNAME::$host.name$\tSERVICEDESC::$service.name$\tSERVICEPERFDATA::$service.perfdata$\tSERVICECHECKCOMMAND::$service.check_command$$pnp_check_arg1$\tHOSTSTATE::$host.state$\tHOSTSTATETYPE::$host.state_type$\tSERVICESTATE::$service.state$\tSERVICESTATETYPE::$service.state_type$"
rotation_interval = 15s
}
I only changed the definition of the service_format_template. All other configurable options are still default. And even this is only a minor change, which in short looks like this:
SERVICECHECKCOMMAND::$service.check_command$$pnp_check_arg1$
With that change, Icinga 2's PerfdataWriter is ready. But the variable needs yet to be set within the service object. As I use apply rules on such generic service checks as "Network IO", this was a quick modification in the apply rule of this service:
$ cat /etc/icinga2/zones.d/global-templates/applyrules/networkio.conf
apply Service "Network IO " for (interface in host.vars.interfaces) {
import "generic-service"
check_command = "nrpe"
vars.nrpe_command = "check_netio"
vars.nrpe_arguments = [ interface ]
vars.pnp_check_arg1 = "_$nrpe_command$"
assign where host.address && host.vars.interfaces && host.vars.os == "Linux"
ignore where host.vars.applyignore.networkio == true
}
In this apply rule, where the "Network IO" service object is assigned to all Linux hosts (host.vars.os == "Linux") with existing interfaces (host.vars.interfaces), I simply added the value for the vars.pnp_check_arg1 variable. Which, in this case, is an underscore followed by the actual command launched by NRPE: "_check_netio".
After a reload of Icinga 2 and a manual check in the performance log file, all things look good. Which means: The SERVICECHECKCOMMAND now contains both nrpe and the remote command (nrpe_check_netio):
$ cat /var/spool/icinga2/perfdata/service-perfdata*
[...]
DATATYPE::SERVICEPERFDATA TIMET::1483441246 HOSTNAME::remotehost SERVICEDESC::Network IO eth0 SERVICEPERFDATA::NET_eth0_RX=2316977634837B;;;; NET_eth0_TX=41612088322B;;;; SERVICECHECKCOMMAND::nrpe_check_netio HOSTSTATE::UP HOSTSTATETYPE::HARD SERVICESTATE::OK SERVICESTATETYPE::HARD
[...]
Icinga 2 now gives the correct and unique information to PNP4Nagios. But PNP4Nagios still needs to be told what to do. PNP4Nagios parses every line of the performance data it gets from Icinga 2 and checks if there is any template for the found command. Prior to the changes in the PerfdataWriter this was always only "nrpe", so PNP4Nagios used the following file: /etc/pnp4nagios/check_commands/check_nrpe.cfg. This is a standard file which comes with the PNP4Nagios installation.
Now that the command is "nrpe_check_netio", PNP4Nagios checks if there is any command definition called like this. When log level >=2 is activated within PNP4Nagios' perfdata process (set LOG_LEVEL to at least 2 in /etc/pnp4nagios/process_perfdata.cfg), the LOG_FILE (usually /var/log/pnp4nagios/perfdata.log) will show the following information:
$ cat /var/log/pnp4nagios/perfdata.log
[...]
2017-01-03 12:22:55 [15957] [3] DEBUG: RAW Command -> nrpe_check_netio
2017-01-03 12:22:55 [15958] [3] -- name -> pl
2017-01-03 12:22:55 [15958] [3] -- rrd_heartbeat -> 8460
2017-01-03 12:22:55 [15957] [2] No Custom Template found for nrpe_check_netio (/etc/pnp4nagios/check_commands/nrpe_check_netio.cfg)
[...]
PNP4Nagios now correctly understood that this is performance data for the command "nrpe_check_netio". And now we can create this config file and tell PNP4Nagios to create DERIVE graphs. DERIVE is another kind of COUNTER data type with the difference that DERIVE values can be resetted to 0, which is the case for the values in ifconfig.
$ cat /etc/pnp4nagios/check_commands/nrpe_check_netio.cfg
#
# Adapt the Template if check_command should not be the PNP Template
#
# check_command check_nrpe!check_disk!20%!10%
# ________0__________| | | |
# ________1_____________________| | |
# ________2____________________________| |
# ________3_______________________________|
#
CUSTOM_TEMPLATE = 1
#
# Change the RRD Datatype based on the check_command Name.
# Defaults to GAUGE.
#
# Adjust the whole RRD Database
DATATYPE = DERIVE
#
# Adjust every single DS by using a List of Datatypes.
DATATYPE = DERIVE,DERIVE
# Use the MIN value for newly created RRD Databases.
# This value defaults to 0
# USE_MIN_ON_CREATE = 1
#
# Use the MAX value for newly created RRD Databases.
# This value defaults to 0
# USE_MAX_ON_CREATE = 1
# Use a single RRD Database per Service
# This Option is only used while creating new RRD Databases
#
#RRD_STORAGE_TYPE = SINGLE
#
# Use multiple RRD Databases per Service
# One RRD Database per Datasource.
# RRD_STORAGE_TYPE = MULTIPLE
#
RRD_STORAGE_TYPE = MULTIPLE
# RRD Heartbeat in seconds
# This Option is only used while creating new RRD Databases
# Existing RRDs can be changed by "rrdtool tune"
# More on http://oss.oetiker.ch/rrdtool/doc/rrdtune.en.html
#
# This value defaults to 8640
# RRD_HEARTBEAT = 305
After a new check of a Network IO service, the xml file of that particular service was re-created with the following information:
# cat /var/lib/pnp4nagios/perfdata/remotehost/Network_IO_eth0.xml
<?xml version="1.0" encoding="UTF-8" standalone="yes"?>
<NAGIOS>
<DATASOURCE>
<TEMPLATE>nrpe_check_netio</TEMPLATE>
<RRDFILE>/var/lib/pnp4nagios/perfdata/remotehost/Network_IO_eth0_NET_eth0_RX.rrd</RRDFILE>
<RRD_STORAGE_TYPE>MULTIPLE</RRD_STORAGE_TYPE>
<RRD_HEARTBEAT>8460</RRD_HEARTBEAT>
<IS_MULTI>0</IS_MULTI>
<DS>1</DS>
<NAME>NET_eth0_RX</NAME>
<LABEL>NET_eth0_RX</LABEL>
<UNIT>B</UNIT>
<ACT>1462883655</ACT>
<WARN></WARN>
<WARN_MIN></WARN_MIN>
<WARN_MAX></WARN_MAX>
<WARN_RANGE_TYPE></WARN_RANGE_TYPE>
<CRIT></CRIT>
<CRIT_MIN></CRIT_MIN>
<CRIT_MAX></CRIT_MAX>
<CRIT_RANGE_TYPE></CRIT_RANGE_TYPE>
<MIN></MIN>
<MAX></MAX>
</DATASOURCE>
<DATASOURCE>
<TEMPLATE>nrpe_check_netio</TEMPLATE>
<RRDFILE>/var/lib/pnp4nagios/perfdata/remotehost/Network_IO_eth0_NET_eth0_TX.rrd</RRDFILE>
<RRD_STORAGE_TYPE>MULTIPLE</RRD_STORAGE_TYPE>
<RRD_HEARTBEAT>8460</RRD_HEARTBEAT>
<IS_MULTI>0</IS_MULTI>
<DS>1</DS>
<NAME>NET_eth0_TX</NAME>
<LABEL>NET_eth0_TX</LABEL>
<UNIT>B</UNIT>
<ACT>1567726688</ACT>
<WARN></WARN>
<WARN_MIN></WARN_MIN>
<WARN_MAX></WARN_MAX>
<WARN_RANGE_TYPE></WARN_RANGE_TYPE>
<CRIT></CRIT>
<CRIT_MIN></CRIT_MIN>
<CRIT_MAX></CRIT_MAX>
<CRIT_RANGE_TYPE></CRIT_RANGE_TYPE>
<MIN></MIN>
<MAX></MAX>
</DATASOURCE>
<RRD>
<RC>0</RC>
<TXT>successful updated</TXT>
</RRD>
<NAGIOS_AUTH_HOSTNAME>remotehost</NAGIOS_AUTH_HOSTNAME>
<NAGIOS_AUTH_SERVICEDESC>Network IO eth0</NAGIOS_AUTH_SERVICEDESC>
<NAGIOS_CHECK_COMMAND>nrpe_check_netio</NAGIOS_CHECK_COMMAND>
<NAGIOS_DATATYPE>SERVICEPERFDATA</NAGIOS_DATATYPE>
<NAGIOS_DISP_HOSTNAME>remotehost</NAGIOS_DISP_HOSTNAME>
<NAGIOS_DISP_SERVICEDESC>Network IO eth0</NAGIOS_DISP_SERVICEDESC>
<NAGIOS_HOSTNAME>remotehost</NAGIOS_HOSTNAME>
<NAGIOS_HOSTSTATE>UP</NAGIOS_HOSTSTATE>
<NAGIOS_HOSTSTATETYPE>HARD</NAGIOS_HOSTSTATETYPE>
<NAGIOS_MULTI_PARENT></NAGIOS_MULTI_PARENT>
<NAGIOS_PERFDATA>NET_eth0_RX=1462883655B;;;; NET_eth0_TX=1567726688B;;;; </NAGIOS_PERFDATA>
<NAGIOS_RRDFILE></NAGIOS_RRDFILE>
<NAGIOS_SERVICECHECKCOMMAND>nrpe_check_netio</NAGIOS_SERVICECHECKCOMMAND>
<NAGIOS_SERVICEDESC>Network_IO_eth0</NAGIOS_SERVICEDESC>
<NAGIOS_SERVICEPERFDATA>NET_eth0_RX=1462883655B;;;; NET_eth0_TX=1567726688B;;;;</NAGIOS_SERVICEPERFDATA>
<NAGIOS_SERVICESTATE>OK</NAGIOS_SERVICESTATE>
<NAGIOS_SERVICESTATETYPE>HARD</NAGIOS_SERVICESTATETYPE>
<NAGIOS_TIMET>1483442747</NAGIOS_TIMET>
<NAGIOS_XMLFILE>/var/lib/pnp4nagios/perfdata/remotehost/Network_IO_eth0.xml</NAGIOS_XMLFILE>
<XML>
<VERSION>4</VERSION>
</XML>
</NAGIOS>
The xml file shows that the nrpe_check_netio PNP4Nagios template is now used:
<TEMPLATE>nrpe_check_netio</TEMPLATE>
and the service check command is correctly identified as nrpe_check_netio:
<NAGIOS_CHECK_COMMAND>nrpe_check_netio</NAGIOS_CHECK_COMMAND>
Once /etc/pnp4nagios/check_commands/nrpe_check_netio.cfg was created, all the other hosts with this "Network IO" check were adapted and are now showing the correct graphs.
The same procedure can now be created for all kinds of plugins which are
executed through NRPE and output counter/derive values, for example check_diskio.
No comments yet.

AI AWS Android Ansible Apache Apple Atlassian BSD Backup Bash Bluecoat CMS Chef Cloud Coding Consul Containers CouchDB DB DNS Databases Docker ELK Elasticsearch Filebeat FreeBSD Galera Git GlusterFS Grafana Graphics HAProxy HTML Hacks Hardware Icinga Influx Internet Java KVM Kibana Kodi Kubernetes LVM LXC Linux Logstash Mac Macintosh Mail MariaDB Minio MongoDB Monitoring Multimedia MySQL NFS Nagios Network Nginx OSSEC OTRS Observability Office OpenSearch PHP Perl Personal PostgreSQL PowerDNS Proxmox Proxy Python Rancher Rant Redis Roundcube SSL Samba Seafile Security Shell SmartOS Solaris Surveillance Systemd TLS Tomcat Ubuntu Unix VMware Varnish Virtualization Windows Wireless Wordpress Wyse ZFS Znuny Zoneminder