
I was trying to get to the root cause why certain rsyslog lines were not showing up in Kibana.
HAProxy in a Docker container -> log to a central rsyslog server (runs on the ELK machine)
Central rsyslog server -> Sends received messages to local logstash (using json format)
*.* @localhost:10514;json-template
Logstash receives this on UDP 10514 and sends it to output Elasticsearch:
input {
udp {
host => "0.0.0.0"
port => 10514
codec => "json"
type => "rsyslog"
}
}
output {
if [type] == "rsyslog" {
elasticsearch {
hosts => [ "http://localhost:9200" ]
}
#stdout { codec => rubydebug }
stdout { codec => rubydebug { metadata => true } }
}
}
As you can see, I have enabled rubydebug to see if logstash really receives the messages (this is the "debug" mode to test logstash). Rsyslog receives the remote HAProxy logs:
Aug 25 11:38:00 192.168.40.15 haproxy[23540]: 10.10.10.11:52596 [25/Aug/2017:11:38:00.017] 80 80_enrico_test_/a1b8fdd53241fe9032c1b73ce55292db0e7fe082 0/0/1/2/3 200 389 - - ---- 11/11/0/0/0 0/0 "GET /_health HTTP/1.1"
And I can see with rubydebug in /var/log/syslog, that this entry went through logstash:
Aug 25 13:38:00 inf-elk01-t logstash[8657]: {
Aug 25 13:38:00 inf-elk01-t logstash[8657]: "severity" => "info",
Aug 25 13:38:00 inf-elk01-t logstash[8657]: "@timestamp" => 2017-08-25T09:38:00.000Z,
Aug 25 13:38:00 inf-elk01-t logstash[8657]: "@version" => "1",
Aug 25 13:38:00 inf-elk01-t logstash[8657]: "programname" => "haproxy",
Aug 25 13:38:00 inf-elk01-t logstash[8657]: "procid" => "23540",
Aug 25 13:38:00 inf-elk01-t logstash[8657]: "host" => "0:0:0:0:0:0:0:1",
Aug 25 13:38:00 inf-elk01-t logstash[8657]: "sysloghost" => "192.168.40.15",
Aug 25 13:38:00 inf-elk01-t logstash[8657]: "message" => " 10.10.10.11:52596 [25/Aug/2017:11:38:00.017] 80 80_enrico_test_/a1b8fdd53241fe9032c1b73ce55292db0e7fe082 0/0/1/2/3 200 389 - - ---- 11/11/0/0/0 0/0 \"GET /_health HTTP/1.1\"",
Aug 25 13:38:00 inf-elk01-t logstash[8657]: "type" => "rsyslog",
Aug 25 13:38:00 inf-elk01-t logstash[8657]: "facility" => "local0"
Aug 25 13:38:00 inf-elk01-t logstash[8657]: }
In ES I am able to find this entry:
# curl -s -XGET 'http://localhost:9200/logstash-2017.08.25/_search?pretty=true&q='programname':'haproxy'&q='message':'*52596*'&size=1'
{
"took" : 24,
"timed_out" : false,
"_shards" : {
"total" : 5,
"successful" : 5,
"failed" : 0
},
"hits" : {
"total" : 2,
"max_score" : 1.0,
"hits" : [
{
"_index" : "logstash-2017.08.25",
"_type" : "rsyslog",
"_id" : "AV4ZLz_7KQDa1cUYcoYw",
"_score" : 1.0,
"_source" : {
"severity" : "info",
"@timestamp" : "2017-08-25T09:38:00.000Z",
"@version" : "1",
"programname" : "haproxy",
"procid" : "23540",
"host" : "0:0:0:0:0:0:0:1",
"sysloghost" : "192.168.40.15",
"message" : " 10.10.10.11:52596 [25/Aug/2017:11:38:00.017] 80 80_enrico_test_/a1b8fdd53241fe9032c1b73ce55292db0e7fe082 0/0/1/2/3 200 389 - - ---- 11/11/0/0/0 0/0 \"GET /_health HTTP/1.1\"",
"type" : "rsyslog",
"facility" : "local0"
}
}
]
}
}
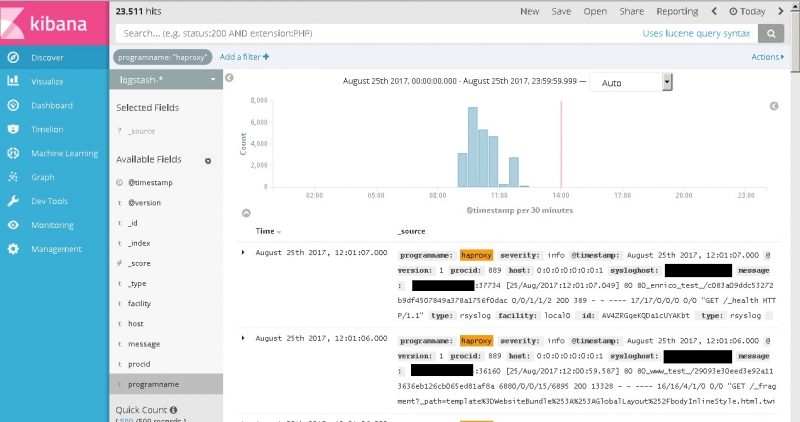
But in Kibana there's nothing:

By chance I clicked on the time range above and set it to "Today" and wow, there it was:
So I had to go much further in the past than expected. But why?
As you can see in the "message", the timestamp coming from the application is set to UTC:
Aug 25 13:38:00 inf-elk01-t logstash[8657]: {
Aug 25 13:38:00 inf-elk01-t logstash[8657]: "severity" => "info",
Aug 25 13:38:00 inf-elk01-t logstash[8657]: "@timestamp" => 2017-08-25T09:38:00.000Z,
Aug 25 13:38:00 inf-elk01-t logstash[8657]: "@version" => "1",
Aug 25 13:38:00 inf-elk01-t logstash[8657]: "programname" => "haproxy",
Aug 25 13:38:00 inf-elk01-t logstash[8657]: "procid" => "23540",
Aug 25 13:38:00 inf-elk01-t logstash[8657]: "host" => "0:0:0:0:0:0:0:1",
Aug 25 13:38:00 inf-elk01-t logstash[8657]: "sysloghost" => "192.168.40.15",
Aug 25 13:38:00 inf-elk01-t logstash[8657]: "message" => " 10.10.10.11:52596 [25/Aug/2017:11:38:00.017] 80 80_enrico_test_/a1b8fdd53241fe9032c1b73ce55292db0e7fe082 0/0/1/2/3 200 389 - - ---- 11/11/0/0/0 0/0 \"GET /_health HTTP/1.1\"",
Aug 25 13:38:00 inf-elk01-t logstash[8657]: "type" => "rsyslog",
Aug 25 13:38:00 inf-elk01-t logstash[8657]: "facility" => "local0"
Aug 25 13:38:00 inf-elk01-t logstash[8657]: }
Note the local time and the time @timestamp inserted into ES:
Aug 25 13:38:00 inf-elk01-t logstash[8657]: "@timestamp" => 2017-08-25T09:38:00.000Z,
This is of course completely wrong. The source of this is the the origin server on which HAProxy is running (a Docker container):
root@dockerhost:~# date
Fri Aug 25 14:10:04 CEST 2017
root@dockerhost:~# docker exec -it 44bddc8b9cb0 bash
root@44bddc8b9cb0:/# date
Fri Aug 25 12:10:06 UTC 2017
This Docker container runs in UTC timezone and is two hours behind the rest of the infrastructure. Ego in Kibana it shows up "in the past".
Now I have to figure out how to tell a Docker container to use the hosts timezone but it's definitely not the fault of the ELK stack. To get some external ideas, I asked how to solve this on the Elastic forums (see https://discuss.elastic.co/t/wrong-time-zone-modification/98372).
No comments yet.

AI AWS Android Ansible Apache Apple Atlassian BSD Backup Bash Bluecoat CMS Chef Cloud Coding Consul Containers CouchDB DB DNS Databases Docker ELK Elasticsearch Filebeat FreeBSD Galera Git GlusterFS Grafana Graphics HAProxy HTML Hacks Hardware Icinga Influx Internet Java KVM Kibana Kodi Kubernetes LVM LXC Linux Logstash Mac Macintosh Mail MariaDB Minio MongoDB Monitoring Multimedia MySQL NFS Nagios Network Nginx OSSEC OTRS Observability Office OpenSearch PHP Perl Personal PostgreSQL PowerDNS Proxmox Proxy Python Rancher Rant Redis Roundcube SSL Samba Seafile Security Shell SmartOS Solaris Surveillance Systemd TLS Tomcat Ubuntu Unix VMware Varnish Virtualization Windows Wireless Wordpress Wyse ZFS Znuny Zoneminder