
In the past weeks I've seen recurring file system warnings on certain servers. After some investigation it turned out to be Filebeat still hanging on to a already rotated log file and therefore not releasing the inode, ergo not giving back the available disk space to the file system.
Let's start off at the begin. Icinga sent the disk warning for /var:
root@server:~# df -h
Filesystem Type Size Used Avail Use% Mounted on
sysfs sysfs 0 0 0 - /sys
proc proc 0 0 0 - /proc
udev devtmpfs 2.0G 12K 2.0G 1% /dev
devpts devpts 0 0 0 - /dev/pts
tmpfs tmpfs 396M 736K 395M 1% /run
/dev/sda1 ext4 4.5G 2.0G 2.3G 48% /
none tmpfs 4.0K 0 4.0K 0% /sys/fs/cgroup
none fusectl 0 0 0 - /sys/fs/fuse/connections
none debugfs 0 0 0 - /sys/kernel/debug
none securityfs 0 0 0 - /sys/kernel/security
none tmpfs 5.0M 0 5.0M 0% /run/lock
none tmpfs 2.0G 0 2.0G 0% /run/shm
none tmpfs 100M 0 100M 0% /run/user
none pstore 0 0 0 - /sys/fs/pstore
/dev/mapper/vg0-lvvar ext4 37G 33G 3.0G 92% /var
/dev/mapper/vg0-lvtmp ext4 922M 1.2M 857M 1% /tmp
systemd cgroup 0 0 0 - /sys/fs/cgroup/systemd
As you can see, /var is at 92% full.
With lsof we checked for open yet deleted files:
root@server:~# lsof +L1
COMMAND PID USER FD TYPE DEVICE SIZE/OFF NLINK NODE NAME
init 1 root 11w REG 252,1 309 0 79 /var/log/upstart/systemd-logind.log.1 (deleted)
filebeat 30336 root 3r REG 252,1 1538307897 0 326 /var/log/haproxy.log.1 (deleted)
filebeat 30336 root 4r REG 252,1 1474951702 0 2809 /var/log/haproxy.log.1 (deleted)
filebeat 30336 root 6r REG 252,1 1513061121 0 1907 /var/log/haproxy.log.1 (deleted)
filebeat 30336 root 7r REG 252,1 1566966965 0 72 /var/log/haproxy.log.1 (deleted)
filebeat 30336 root 8r REG 252,1 1830485663 0 2558 /var/log/haproxy.log.1 (deleted)
filebeat 30336 root 9r REG 252,1 1426600050 0 163 /var/log/haproxy.log.1 (deleted)
nginx 31673 www-data 64u REG 252,1 204800 0 2978 /var/lib/nginx/proxy/9/53/0008826539 (deleted)
nginx 31674 www-data 154u REG 252,1 204800 0 131334 /var/lib/nginx/proxy/2/95/0008825952 (deleted)
nginx 31676 www-data 111u REG 252,1 241664 0 4064 /var/lib/nginx/proxy/0/54/0008826540 (deleted)
There it is; Filebeat still hanging on to a (meanwhile) rotated HAProxy log file (which is quite big as you can see in the column SIZE/OFF).
To release the inode, Filebeat can either restart or force reloaded.
root@server:~# /etc/init.d/filebeat force-reload
* Restarting Filebeat sends log files to Logstash or directly to Elasticsearch. filebeat
2018/05/23 13:39:20.004534 beat.go:297: INFO Home path: [/usr/share/filebeat] Config path: [/etc/filebeat] Data path: [/var/lib/filebeat] Logs path: [/var/log/filebeat]
2018/05/23 13:39:20.004580 beat.go:192: INFO Setup Beat: filebeat; Version: 5.6.9
2018/05/23 13:39:20.004623 logstash.go:91: INFO Max Retries set to: 3
2018/05/23 13:39:20.004663 outputs.go:108: INFO Activated logstash as output plugin.
2018/05/23 13:39:20.004681 metrics.go:23: INFO Metrics logging every 30s
2018/05/23 13:39:20.004727 publish.go:300: INFO Publisher name: server
2018/05/23 13:39:20.004850 async.go:63: INFO Flush Interval set to: 1s
2018/05/23 13:39:20.006018 async.go:64: INFO Max Bulk Size set to: 2048
Config OK
Verification with lsof again:
root@server:~# lsof +L1
COMMAND PID USER FD TYPE DEVICE SIZE/OFF NLINK NODE NAME
init 1 root 11w REG 252,1 309 0 79 /var/log/upstart/systemd-logind.log.1 (deleted)
nginx 31674 www-data 154u REG 252,1 204800 0 131334 /var/lib/nginx/proxy/2/95/0008825952 (deleted)
Looks better! What about the file system size?
root@server:~# df -h
Filesystem Type Size Used Avail Use% Mounted on
sysfs sysfs 0 0 0 - /sys
proc proc 0 0 0 - /proc
udev devtmpfs 2.0G 12K 2.0G 1% /dev
devpts devpts 0 0 0 - /dev/pts
tmpfs tmpfs 396M 736K 395M 1% /run
/dev/sda1 ext4 4.5G 2.0G 2.3G 48% /
none tmpfs 4.0K 0 4.0K 0% /sys/fs/cgroup
none fusectl 0 0 0 - /sys/fs/fuse/connections
none debugfs 0 0 0 - /sys/kernel/debug
none securityfs 0 0 0 - /sys/kernel/security
none tmpfs 5.0M 0 5.0M 0% /run/lock
none tmpfs 2.0G 0 2.0G 0% /run/shm
none tmpfs 100M 0 100M 0% /run/user
none pstore 0 0 0 - /sys/fs/pstore
/dev/mapper/vg0-lvvar ext4 37G 24G 12G 68% /var
/dev/mapper/vg0-lvtmp ext4 922M 1.2M 857M 1% /tmp
systemd cgroup 0 0 0 - /sys/fs/cgroup/systemd
The /var partition is now back to 68% used. Good!
But how does one prevent this from happening again? In the logrotate config for HAProxy (/etc/logrotate.d/haproxy) I added a postrotate command to reload Filebeat:
root@server:~# cat /etc/logrotate.d/haproxy
/var/log/haproxy.log {
daily
rotate 52
missingok
notifempty
compress
delaycompress
postrotate
invoke-rc.d rsyslog rotate >/dev/null 2>&1 || true
service filebeat force-reload >/dev/null 2>&1
endscript
}
For the last couple of weeks I've been watching this on that particular server and it turns out this definitely solved the problem that Filebeat was still hanging on to inodes not in use anymore. The following graphs shows the disk usage of /var:
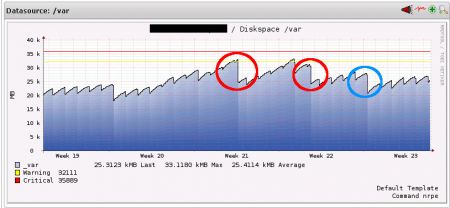
The red circles show when I manually forced a reload of Filebeat.
The blue circle notes the day when I added the "service filebeat force-reload >/dev/null 2>&1" line into postrotate in the logrotate file - and when it first executed (note the significant fall compared to the days before).
I also had to add the reload line to the logrotate config of Nginx, as I'm using Filebeat to go through HAProxy and Nginx logs.
Note: This happened under both Ubuntu 14.04 and 16.04 with Filebeat 5.6.9. Meanwhile Filebeat 6.x is out, maybe this fixes the rotated log file issue but I didn't have the time to upgrade yet.
No comments yet.

AI AWS Android Ansible Apache Apple Atlassian BSD Backup Bash Bluecoat CMS Chef Cloud Coding Consul Containers CouchDB DB DNS Databases Docker ELK Elasticsearch Filebeat FreeBSD Galera Git GlusterFS Grafana Graphics HAProxy HTML Hacks Hardware Icinga Influx Internet Java KVM Kibana Kodi Kubernetes LVM LXC Linux Logstash Mac Macintosh Mail MariaDB Minio MongoDB Monitoring Multimedia MySQL NFS Nagios Network Nginx OSSEC OTRS Observability Office OpenSearch PHP Perl Personal PostgreSQL PowerDNS Proxmox Proxy Python Rancher Rant Redis Roundcube SSL Samba Seafile Security Shell SmartOS Solaris Surveillance Systemd TLS Tomcat Ubuntu Unix VMware Varnish Virtualization Windows Wireless Wordpress Wyse ZFS Znuny Zoneminder