
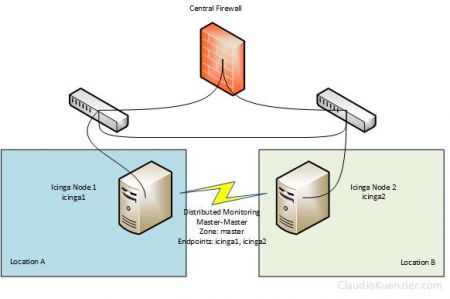
In my new Icinga 2 architecture I run a distributed setup using a master-master configuration. Both master nodes reside in two different data centers but are connected through internal LAN. Almost all host and service objects are within the "master" zone. And both master nodes (called icinga1 and icinga2) are used as endpoints for this master zone.
root@icinga1:~# cat /etc/icinga2/zones.conf
object Endpoint "icinga1" {
host = "icinga1"
}
object Endpoint "icinga2" {
host = "icinga2"
}
object Zone "master" {
endpoints = [ "icinga1", "icinga2" ]
}
object Zone "global-templates" {
global = true
}
object Zone "director-global" {
global = true
}
Icinga automatically distributes checks across both endpoints (in the same zone), therefore balancing the checks. Sometimes the checks are executed on icinga1, sometimes on icinga2. For most of the checks, this turned out to be OK.
But I came across certain checks where I needed to specifically tell Icinga from where/on which node the check must be executed. In this scenario I needed to ping the interface of the central firewall to determine differences in latency between the two locations.
In my previous Icinga setup I used a master-satellite setup to "balance" the checks based on the physical location of the servers to achieve a "different view" of both locations. But in the master-master setup, this is balanced and the graphs contain mixed results over both locations.
So the question is: How can I force a check to be executed on a certain Icinga2 check node?
First I tried to create two additional zones called "locationa" and "locationb" and assigned endpoint "icinga1" to "locationa" and endpoint "icinga2" to "locationb" in zones.conf:
object Zone "locationa" {
endpoints = [ "icinga1" ]
}
object Zone "locationb" {
endpoints = [ "icinga2" ]
}
And then moved the two service objects into the new zone folders (/etc/icinga2/zones.d/locationa and /etc/icinga2/zones.d/locationb).
But a check config showed that this didn't work and resulted in the following error:
# /etc/init.d/icinga2 checkconfig
* checking Icinga2 configuration
information/cli: Icinga application loader (version: r2.8.2-1)
information/cli: Loading configuration file(s).
information/ConfigItem: Committing config item(s).
information/ApiListener: My API identity: icinga1
critical/config: Error: Endpoint 'icinga2' is in more than one zone.
Location: in /etc/icinga2/zones.conf: 5:1-5:30
/etc/icinga2/zones.conf(3): }
/etc/icinga2/zones.conf(4):
/etc/icinga2/zones.conf(5): object Endpoint "icinga2" {
^^^^^^^^^^^^^^^^^^^^^^^^^^^^^^
/etc/icinga2/zones.conf(6): host = "icinga2"
/etc/icinga2/zones.conf(7): }
critical/config: Error: Endpoint 'icinga1' is in more than one zone.
Location: in /etc/icinga2/zones.conf: 1:0-1:29
/etc/icinga2/zones.conf(1): object Endpoint "icinga1" {
^^^^^^^^^^^^^^^^^^^^^^^^^^^^^^
/etc/icinga2/zones.conf(2): host = "icinga1"
/etc/icinga2/zones.conf(3): }
critical/config: 2 errors
* checking Icinga2 configuration. Check '/var/log/icinga2/startup.log' for details.
Note: In newer Icinga2 versions, you'd use the icinga2 daemon -C command to verify the config.
An endpoint cannot be used in multiple zones, unfortunately.
So back to step one and I started from scratch: RTFM. And indeed, I came across this: "Pin Checks in a Zone".
In case you want to pin specific checks to their endpoints in a given zone you’ll need to use the command_endpoint attribute. This is reasonable if you want to execute a local disk check in the master Zone on a specific endpoint then.
Wow. That sounds exactly what I need. So I added the "command_endpoint" in the two config files:
# cat /etc/icinga2/zones.d/master/network/FW/firewall-locationa.conf
object Host "firewall-locationa" {
import "dummy-host"
}
# check ping
object Service "PING FW Interface VLAN X" {
command_endpoint = "icinga1"
import "generic-service"
host_name = "firewall-locationa"
check_command = "ping"
vars.ping_address = "192.168.99.1"
}
# cat /etc/icinga2/zones.d/master/network/FW/firewall-locationb.conf
object Host "firewall-locationb" {
import "dummy-host"
}
# check ping
object Service "PING FW Interface VLAN X" {
command_endpoint = "icinga2"
import "generic-service"
host_name = "firewall-locationb"
check_command = "ping"
vars.ping_address = "192.168.99.1"
}
Check config didn't report any errors, so I went ahead.
The check "PING FW Interface VLAN X" on host "firewall-locationb" worked immediately and I could see "check source" was set to "icinga2" in the UI.
But the same check on "firewall-locationa" resulted in an UNKNOWN state and output: Endpoint does not accept commands.
But this is actually quite easy to fix. The "command_endpoint" uses the Icinga 2 API in the background. Because the node icinga2 is actually a slave (although called master-master setup, the second master is setup like a satellite, simply receiving all configs), it is already configured to accept commands in the API feature:
root@icinga2:~# cat /etc/icinga2/features-enabled/api.conf
/**
* The API listener is used for distributed monitoring setups.
*/
object ApiListener "api" {
accept_config = true
accept_commands = true
}
But this line (accept_commands) was missing on node icinga1. Once I added this and restarted Icinga 2, the check for for host "firewall-locationa" was working too.
With these configs I have now the same ping check running to the same destination but from two different sources. Thanks to the graphs of the ping checks I can now see the differences of RTA and Packet Losses.
No comments yet.

AI AWS Android Ansible Apache Apple Atlassian BSD Backup Bash Bluecoat CMS Chef Cloud Coding Consul Containers CouchDB DB DNS Databases Docker ELK Elasticsearch Filebeat FreeBSD Galera Git GlusterFS Grafana Graphics HAProxy HTML Hacks Hardware Icinga Influx Internet Java KVM Kibana Kodi Kubernetes LVM LXC Linux Logstash Mac Macintosh Mail MariaDB Minio MongoDB Monitoring Multimedia MySQL NFS Nagios Network Nginx OSSEC OTRS Observability Office OpenSearch PHP Perl Personal PostgreSQL PowerDNS Proxmox Proxy Python Rancher Rant Redis Roundcube SSL Samba Seafile Security Shell SmartOS Solaris Surveillance Systemd TLS Tomcat Ubuntu Unix VMware Varnish Virtualization Windows Wireless Wordpress Wyse ZFS Znuny Zoneminder