
Enterprises have started to use "the Cloud" more and more often in the past few years. Applications are sometimes running completely in the cloud, sometimes as a hybrid construct. In a hybrid environment, some "parts" of the application architecture (for example a database) are running in the cloud, while others (for example an API server) is running on premise. Sometimes the other way around, the combinations are endless.
Using a hybrid architecture has several positive points. If you build your application and its architecture correctly, you may run the full stack in either location (on-premise and in the cloud). Which means you now got a disaster recovery environment for your application. That's pretty neat.
But this also leads to additional problems: Network interruptions and latency between on-premise and the cloud may cause at least delays, at worst outages, in the application. The Internet connection between these two points becomes a very important dependency.
We've been using a hybrid architecture for a couple of years by now and mostly this runs pretty well. But when we do experience issues (e.g. timeouts), we need to find the source of the problem as soon as possible. Most of the times in the past we've identified the Internet connectivity between the on-premise data center and the cloud as source. But whose fault is it? Our own (firewall), our Internet Service Provider (ISP), the Cloud Service Provider (CSP) or something in between (Internet Exchanges)?
That question was never easy to answer and whenever we contacted our ISP to help identify where the problem was, it took 2 days to get a response which mostly didn't help us either (in technical aspects).
What you do in such moments of connectivity problems is: Troubleshooting. And this includes getting as much data from all available resources you got. Check stats and graphs from monitoring, external verification (is it just me or everyone?) and most importantly a connectivity check. A very well known tool for this is "mtr" which stands for "my traceroute". It's basically an advanced version of the classic traceroute (or tracert in Windows) command.
By following the mtr output, sometimes the hop causing the issue can be identified immediately. But in almost all the cases I wished to have a comparison at hand: Now we're going through these 20 hops, but what happened 30 minutes ago, when there were no connectivity issues?
I've been looking for a monitoring plugin which basically runs mtr and graphs the data for a couple of months, but there was no real solution. Until I finally came across a GitHub repository where mtr is run in the background from a python command. The results are written into a time series database (InfluxDB). Sounded pretty good to me and I gave it a try. Unfortunately there were some problems in running the python script standalone. It was supposed to be started within a Docker container and install an InfluxDB inside that container, which I didn't want.
Note: If you don't have an InfluxDB at hand (or you don't know how to administrate InfluxDB) and don't mind that you run the data in a container, the existing script is great!
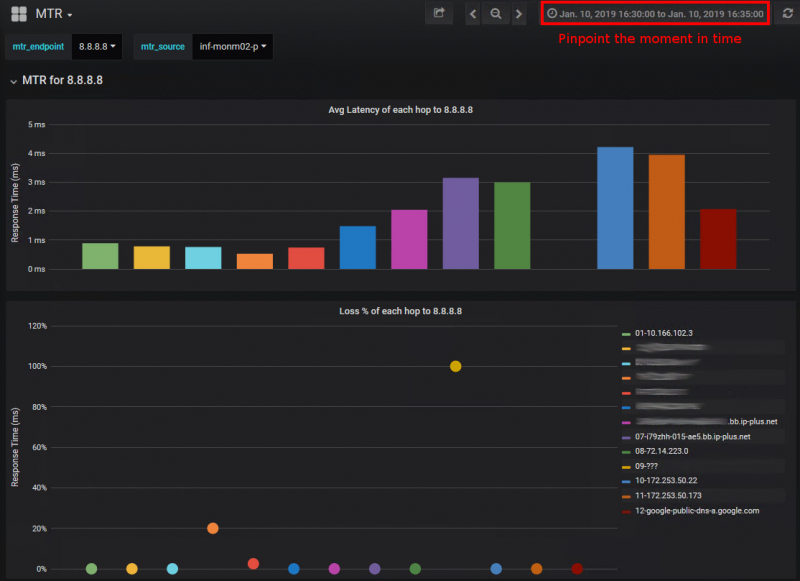
I rewrote that script in Bash and added some additional stuff. Then I let it run in a 2 minute interval for a couple of destinations. Each hop and it's data (latency, packet loss, etc) is entered into InfluxDB using the timestamp of that run. Using a Grafana dashboard it is now possible to see the exact hops, their latencies and packet drops at a certain moment in time. This also allows to compare the different hops in case there was a routing change.
Now that I had this tool in place and collecting data, I just needed to wait for the next outage.
Yesterday, January 10 2019 it finally happened. We experienced timeouts in all our web applications which connect to an ElasticSearch service in the cloud, running in AWS Ireland. Thanks to our monitoring we almost immediately saw that the latency between our applications in our data center and ElasticSearch spiked, while the same checks from within AWS Ireland were still around the same:
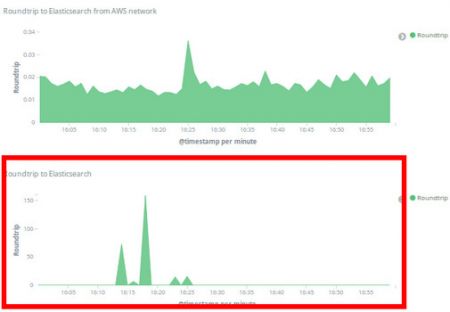
There was a downtime of 13 minutes for most of our web applications between 16:13 and 16:26. Once the issue was resolved the blame game started (of course!).
But this time I was able to refer to the MTR Dashboard and compared the hops at 16:00-16:05 with 16:15-16:20 and with 16:30-16:35:
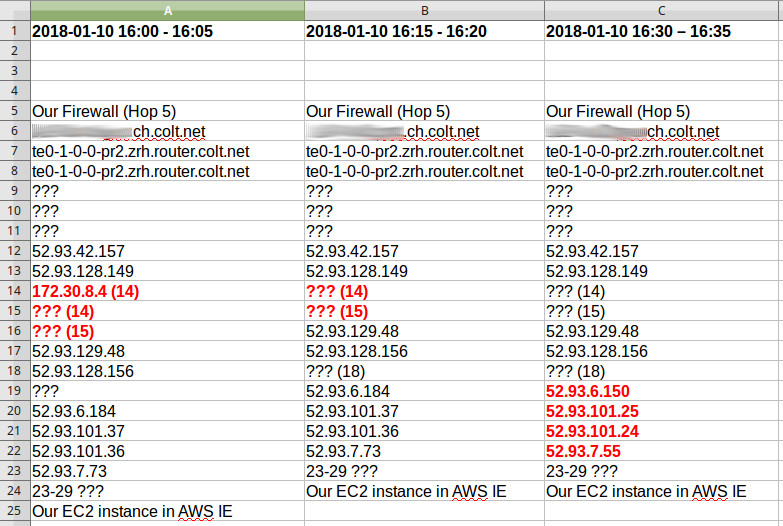
By comparing the hops side by side something interesting is revealed: There were indeed routing changes but only after the hop 52.93.128.156, which already belongs to AWS.
This means that there were some internal routing changes causing the outage. Yet in the AWS status dashboard, everything was green (as always...).
Thanks to this MTR dashboard we are now able to identify when a routing change happened and where and therefore can help solve the blame game.
PS: I will release the Bash script, installations instructions and the Grafana dashboard (it's slightly different than the one of the mtr-monitor repository) on GitHub soon.
Ben from wrote on Feb 20th, 2020:
Following up from Dans comment, I would also be interested in your script on github once you release it.
Dan from Isle of Man wrote on Oct 5th, 2019:
Looking forward to you releasing your installation scripts/instructions on Github, I need to setup just this kind of monitoring too please.
Claudio from Switzerland wrote on May 17th, 2019:
ppjms, I will (hopefully) soon write another article on this where I describe the script and the Grafana dashboard. The code will be placed on GitHub.
ppjms from philippines wrote on May 16th, 2019:
Can i ask how you do it?
thinking to add this to our ISP monitoring on grafana
Thank you

AI AWS Android Ansible Apache Apple Atlassian BSD Backup Bash Bluecoat CMS Chef Cloud Coding Consul Containers CouchDB DB DNS Databases Docker ELK Elasticsearch Filebeat FreeBSD Galera Git GlusterFS Grafana Graphics HAProxy HTML Hacks Hardware Icinga Influx Internet Java KVM Kibana Kodi Kubernetes LVM LXC Linux Logstash Mac Macintosh Mail MariaDB Minio MongoDB Monitoring Multimedia MySQL NFS Nagios Network Nginx OSSEC OTRS Observability Office OpenSearch PHP Perl Personal PostgreSQL PowerDNS Proxmox Proxy Python Rancher Rant Redis Roundcube SSL Samba Seafile Security Shell SmartOS Solaris Surveillance Systemd TLS Tomcat Ubuntu Unix VMware Varnish Virtualization Windows Wireless Wordpress Wyse ZFS Znuny Zoneminder