
In the past week a problem with one of our Varnish 4.1 instances literally took my whole time. Weird load spikes occasionally happened, causing Varnish to "freeze" (but not crash), leading to timeouts for some (weirdly not all) http requests. It took quite a moment to find the culprit, but eventually we (System Engineers and Developers) were able to solve this together. This is the story about analyzing, troubleshooting and eventually solving these never before seen Varnish issues.
We recently switched from a PHP-based backend to a new Node-based backend, using NuxtJS. Both old and new backends run as n application containers in the same container infrastructure. Network-wise nothing has changed, the data flow is still exactly the same as before.
The following graph explains how Varnish is used in this setup:
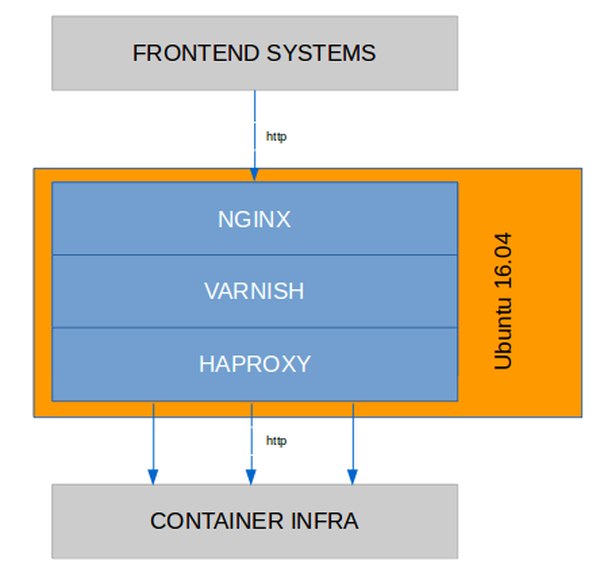
Varnish version was the (as of now) newest 4.1 release (4.1.11). The used VCL didn't differ much from a default VCL, except with one change:
Support ESI Includes: As mentioned, the new application backend uses Edge Side Includes (ESI). Varnish needs to know about this. We added a snippet in vcl_backend_response where we defined the paths we knew there would be no ESI includes happening (negate regex):
# announce to backend that varnish can handle esi
set bereq.http.Surrogate-Capability = "abc=ESI/1.0";
# Check for ESI acknowledgement and remove Surrogate-Control header
if (beresp.http.Surrogate-Control ~ "ESI/1.0") {
unset beresp.http.Surrogate-Control;
set beresp.do_esi = true;
set beresp.do_gzip = true;
}
With this information, Varnish can now put together the final document and place it into its cache.
Besides this, the VCL defined no caching TTL's. The backend application would define this and tell Varnish how long to cache content using the "max-age" value.
Around one week after going on production with the new Nuxt application, the issues started. Monitoring noticed timeouts on the Varnish instance. It took longer than 10 seconds to get the (cached) homepage. That's definitely way too long. The first thought was a Varnish crash but no crash was reported in /var/log/syslog and the process was still running. However the process was running with 100% CPU.
top confirmed:
root@server:~# top -bc -d 60 -n 5
top - 17:31:58 up 72 days, 10:34, 2 users, load average: 0.97, 1.08, 1.22
Tasks: 179 total, 2 running, 177 sleeping, 0 stopped, 0 zombie
%Cpu(s): 13.1 us, 3.2 sy, 0.0 ni, 81.4 id, 0.1 wa, 0.0 hi, 2.3 si, 0.0 st
KiB Mem : 32947468 total, 3666532 free, 22404944 used, 6875992 buff/cache
KiB Swap: 3906556 total, 3465756 free, 440800 used. 9870660 avail Mem
PID USER PR NI VIRT RES SHR S %CPU %MEM TIME+ COMMAND
9640 vcache 20 0 2332640 1.222g 85588 S 106.7 3.9 305:02.53 /usr/sbin/varnishd -j unix,user=vcache -n varnish-instance -F -a :7081 -T localhost:7082+
1 root 20 0 185664 5272 3268 S 0.0 0.0 8:09.53 /sbin/init
2 root 20 0 0 0 0 S 0.0 0.0 0:00.40 [kthreadd]
3 root 20 0 0 0 0 S 0.0 0.0 11:26.34 [ksoftirqd/0]
[...]
Interestingly when the traffic was failovered to a standby Varnish instance the CPU usage staid at around and over 100%. Although no traffic would arrive on this Varnish instance anymore.
Some tests with local http requests using curl revealed that Varnish still delivered some content, however very slowly:
root@server:~# time curl -H "Host: app.example.com" localhost:7081/
[...]
real 11m11.964s
user 0m0.012s
sys 0m0.008s
Yes, curl needed to wait more than 11 minutes to get a response. Even in the 90s with a 56k modem nobody would wait that long for a website to load.
An immediate workaround was to restart this Varnish instance. But to solve this problem, it needs to be solved at the source and find what is causing these high load spikes and resulting in timeouts.
Obviously the first tools to inspect a Varnish issue are:
But on first sight, nothing could be identified from the output of these commands.
In a timeline of a few days, this issue happened a couple of times.
Sometimes several times a day, then sometimes running for a couple of
days as it should. At first PURGE requests were suspected to cause this
but this turned out not to be the causing source. But by comparing the varnishstat output from the last incidents, one similarity was found: The MAIN.esi_errors field was always set to 1. So far that was the only hint.
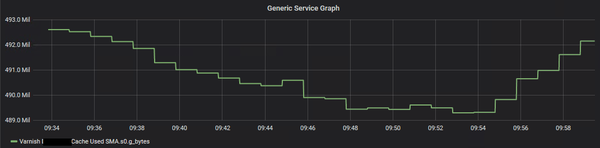
Another idea was a problem with the shared memory allocation of the Varnish process, although we could not find hints as OOM. So we decided to ramp up monitoring and add more varnishstat values into our monitoring, using check_varnish.py.
The next time the issue occurred, the monitoring stats revealed... not much.
Back to analyzing again. Using varnishlog and VSL queries, the traffic was inspected for general errors or if the backend itself would maybe cause a hiccup in Varnish. And to my big surprise it didn't take long until this was caught:
root@server:~# varnishlog -n varnish-instance -q "(*Error) or (BerespStatus >= 500)"
* << BeReq >> 36
- Begin bereq 35 pass
- Timestamp Start: 1564133975.637235 0.000000 0.000000
- BereqMethod GET
- BereqURL /dynamic-partials/partial/esiContent
- BereqProtocol HTTP/1.1
- BereqHeader Host: app.example.com
- BereqHeader X-Forwarded-Proto: http
- BereqHeader User-Agent: check_http/v2.1.2 (monitoring-plugins 2.1.2)
- BereqHeader Accept-Encoding: gzip
- BereqHeader X-Varnish: 36
- VCL_call BACKEND_FETCH
- VCL_return fetch
- BackendOpen 24 boot.backend 127.0.0.1 8083 127.0.0.1 36106
- BackendStart 127.0.0.1 8083
- Timestamp Bereq: 1564133975.637294 0.000060 0.000060
- Timestamp Beresp: 1564133975.657512 0.020278 0.020218
- BerespProtocol HTTP/1.1
- BerespStatus 200
- BerespReason OK
- BerespHeader Content-Type: text/html; charset=utf-8
- BerespHeader Cache-Control: private, max-age=0
- BerespHeader Content-Length: 51413
- BerespHeader ETag: W/"c8d5-4DIVVxV5KxxoeEUGW7OxpP4oZWs"
- BerespHeader Date: Fri, 26 Jul 2019 09:39:35 GMT
- TTL RFC 0 10 -1 1564133976 1564133976 1564133975 0 0
- VCL_call BACKEND_RESPONSE
- BereqHeader Surrogate-Capability: abc=ESI/1.0
- TTL VCL 86400 10 0 1564133976
- TTL VCL 86400 86400 0 1564133976
- VCL_return deliver
- BerespUnset Content-Length: 51413
- BerespHeader Content-Encoding: gzip
- BerespHeader Vary: Accept-Encoding
- Storage malloc Transient
- ObjProtocol HTTP/1.1
- ObjStatus 200
- ObjReason OK
- ObjHeader Content-Type: text/html; charset=utf-8
- ObjHeader Cache-Control: private, max-age=0
- ObjHeader ETag: W/"c8d5-4DIVVxV5KxxoeEUGW7OxpP4oZWs"
- ObjHeader Date: Fri, 26 Jul 2019 09:39:35 GMT
- ObjHeader Content-Encoding: gzip
- ObjHeader Vary: Accept-Encoding
- Fetch_Body 3 length -
- ESI_xmlerror No ESI processing, first char not '<'. (See feature esi_disable_xml_check)
- Gzip G F E 51413 13544 80 108272 108282
- BackendReuse 24 boot.backend
- Timestamp BerespBody: 1564133975.659685 0.022450 0.002172
- Length 13544
- BereqAcct 477 0 477 198 0 198
- End
Keeping varnishlog running, this ESXI_xmlerror came up quite frequently. This was the moment of realization: This problem cannot be solved by only System Engineers, we need the input of the developers what is going on in the background using these ESI includes.
Everything seemed to be pointing to a problem with ESI. Never before have we had (performance?) issues like this with a Varnish instance - and Varnish is in heavy usage for at least 3 years. The varnishstat output always increased its MAIN.esi_errors counter to 1 when the problem occurred. And now there were hundreds of entries with ESI_xmlerror caught with varnishlog. Time to get together with the developers and figure out what is actually going on the background.
This turned out to be a crucial moment. We learned that the application would on every request make an ESI call to /dynamic-partials/partial/esiContent. Path looks pretty familiar, right (see varnishstat output above)? But not only would this path be requested in the background by the server (not client), this path also contained user data based on a unique ID created by the frontend systems (before the dataflow would even hit Varnish). Means: This content cannot be cached. The backend's response also set this in its response header (Cache-Control: private, max-age=0), seen in varnishlog.
Interestingly when a short cache was added for the /dynamic-partials path, using a fixed TTL in the VCL, the issue could not be reproduced anymore. But as mentioned before, due to the content serving unique information, a caching was unfortunately not possible.
Another important information we got was that the included paths did not start with in html/xml style (meaning no '<' at the begin).
Finally a way to reproduce this issue was found by stress-testing the application. This allowed the tuning of the VCL in the test environment.
After increased research time, the VCL was adjusted to tell Varnish already in advance to do ESI processing, not just when it gets the response from the backend (where it might already be too late):
# announce to backend, that varnish can handle esi
# http://symfony.com/doc/current/cookbook/cache/varnish.html
set bereq.http.Surrogate-Capability = "abc=ESI/1.0";
# Do ESI processing
if (bereq.url !~ "(^/api|\.ico$|\.js$|\.css$)") {
set beresp.do_esi = true; // Do ESI processing
}
Furthermore the Varnish feature "esi_disable_xml_check" was enabled. This should improve performance to not validate each included ESI block as xml file. To add this feature, the feature was added to the ExecStart definition in the Systemd unit file for this Varnish instance:
root@server:~# cat /etc/systemd/system/varnish-instance.service | grep ExecStart
ExecStart=/usr/sbin/varnishd -j unix,user=vcache -n varnish-instance -F -a :7081 -T localhost:7082 -f /etc/varnish/instance.vcl -S /etc/varnish/secret -s malloc,4096m -p feature=+esi_disable_xml_check
After these changes were applied, the ESI_xmlerror events disappeared and were not seen anymore with varnishlog.
So far all obvious ESI errors disappeared from the logs yet the issue could still be reproduced using the stress-test method. By watching varnishlog's output during another stress-test we came across the "Debug" field and saw a lot of errors like this:
- Debug "Write error, retval = -1, len = 49669, errno = Broken pipe"
These log entries seemed to correlate whenever the developer, who launched the stress-test using npm artillery, announced that the backend is now dead again.
A couple of potential reasons came into our minds:
An upgrade to the new LTS version 6.0 would not be that quick as potentially the whole VCL needs to be rewritten. But a downgrade to 4.1.10 and even 4.1.6 showed the same issue was still happening. So a (new) bug in 4.1.11 could be ruled out.
The focus was shifted towards analyzing the backend response times. Until now Varnish was the only suspect and all slowness would be caused by Varnish or the frontend systems before Varnish. But using siege revealed something interesting by doing a stress-test on localhost:
root@server:~# siege -H "Host: app.example.com" -c 250 -b http://localhost:7081/ -v
[...]
HTTP/1.1 200 21.49 secs: 64517 bytes ==> GET /
HTTP/1.1 200 20.55 secs: 64517 bytes ==> GET /
HTTP/1.1 200 8.08 secs: 64517 bytes ==> GET /
HTTP/1.1 200 0.71 secs: 64517 bytes ==> GET /
HTTP/1.1 200 13.69 secs: 64517 bytes ==> GET /
HTTP/1.1 200 11.78 secs: 64517 bytes ==> GET /
HTTP/1.1 200 13.16 secs: 64517 bytes ==> GET /
HTTP/1.1 200 8.48 secs: 64517 bytes ==> GET /
HTTP/1.1 200 1.46 secs: 64517 bytes ==> GET /
HTTP/1.1 200 4.87 secs: 64517 bytes ==> GET /
HTTP/1.1 200 34.90 secs: 64517 bytes ==> GET /
HTTP/1.1 200 0.83 secs: 64517 bytes ==> GET /
HTTP/1.1 200 40.95 secs: 64517 bytes ==> GET /
HTTP/1.1 200 2.47 secs: 64517 bytes ==> GET /
HTTP/1.1 200 20.87 secs: 64517 bytes ==> GET /
HTTP/1.1 200 3.69 secs: 64517 bytes ==> GET /
HTTP/1.1 200 3.58 secs: 64517 bytes ==> GET /
HTTP/1.1 200 15.28 secs: 64517 bytes ==> GET /
HTTP/1.1 200 14.17 secs: 64517 bytes ==> GET /
HTTP/1.1 200 5.53 secs: 64517 bytes ==> GET /
HTTP/1.1 200 36.87 secs: 64517 bytes ==> GET /
[...]
^C
Lifting the server siege... done.
Transactions: 2243 hits
Availability: 100.00 %
Elapsed time: 64.21 secs
Data transferred: 138.03 MB
Response time: 6.01 secs
Transaction rate: 34.93 trans/sec
Throughput: 2.15 MB/sec
Concurrency: 209.77
Successful transactions: 2243
Failed transactions: 0
Longest transaction: 40.95
Shortest transaction: 0.01
At the begin of the stress-test all responses came in pretty quickly. But the longer the test endured, the slower the responses became. Even though the "/" path was cached by Varnish.
During the stress-test, varnishlog was used to measure the timestamps. We figured out that the "Timestamp Fetch" field would show how long it took Varnish to retrieve the object (either from the cache or from the backend if it was not cached):
root@server:~# varnishlog -n varnish-instance | egrep "(BereqURL|^- Debug|RespStatus|Timestamp.*Beresp:|Timestamp.*Fetch:)"
[...]
- RespStatus 200
- Debug "RES_MODE 18"
- BereqURL /dynamic-partials/partial/esiContent
- Timestamp Beresp: 1564555495.345787 0.029674 0.029504
- Timestamp Fetch: 1564555495.360615 15.275820 0.049993
- RespStatus 200
- RespStatus 200
- Debug "RES_MODE 18"
- BereqURL /dynamic-partials/partial/esiContent
- Timestamp Beresp: 1564555495.369367 0.008701 0.008573
- Timestamp Fetch: 1564555495.383749 14.147140 0.023114
- RespStatus 200
- RespStatus 200
- Debug "RES_MODE 18"
- BereqURL /dynamic-partials/partial/esiContent
- Timestamp Beresp: 1564555495.405162 0.021375 0.021259
- Timestamp Fetch: 1564555495.420919 5.501442 0.037160
- RespStatus 200
- RespStatus 200
- Debug "RES_MODE 18"
- BereqURL /dynamic-partials/partial/esiContent
- Timestamp Beresp: 1564555495.438648 0.011123 0.011039
- Timestamp Fetch: 1564555495.458724 36.866717 0.037768
- RespStatus 200
- RespStatus 200
- Debug "RES_MODE 18"
- Timestamp Fetch: 1564555495.498275 8.146323 0.039518
- RespStatus 200
- RespStatus 200
- Debug "RES_MODE 18"
- BereqURL /dynamic-partials/partial/esiContent
- Timestamp Beresp: 1564555495.481560 0.016063 0.015905
- Timestamp Fetch: 1564555495.555958 8.294873 0.057671
- RespStatus 200
- RespStatus 200
- Debug "RES_MODE 18"
- BereqURL /dynamic-partials/partial/esiContent
- Timestamp Beresp: 1564555495.545744 0.047308 0.047090
- BereqURL /dynamic-partials/partial/esiContent
- Timestamp Beresp: 1564555495.578029 0.011943 0.011724
- Timestamp Fetch: 1564555495.594198 3.773306 0.038218
- RespStatus 200
- RespStatus 200
- Debug "RES_MODE 18"
- BereqURL /dynamic-partials/partial/esiContent
- Timestamp Beresp: 1564555495.612558 0.018229 0.017821
- Timestamp Fetch: 1564555495.621327 4.362154 0.027126
- RespStatus 200
- RespStatus 200
- Debug "RES_MODE 18"
- BereqURL /dynamic-partials/partial/esiContent
- Timestamp Beresp: 1564555495.646678 0.019511 0.019224
- Timestamp Fetch: 1564555495.653712 21.421576 0.032339
- RespStatus 200
- RespStatus 200
- Debug "RES_MODE 18"
- BereqURL /dynamic-partials/partial/esiContent
- Timestamp Beresp: 1564555495.678210 0.018526 0.018154
- Timestamp Fetch: 1564555495.739781 2.977730 0.086018
- RespStatus 200
- RespStatus 200
- Debug "RES_MODE 18"
- Debug "Write error, retval = -1, len = 49669, errno = Broken pipe"
- BereqURL /dynamic-partials/partial/esiContent
- Timestamp Beresp: 1564555495.758343 0.008948 0.008770
- Timestamp Fetch: 1564555495.764594 15.993505 0.024777
- RespStatus 200
- RespStatus 200
- Debug "RES_MODE 18"
- Debug "Write error, retval = -1, len = 49669, errno = Broken pipe"
- Timestamp Fetch: 1564555495.798590 46.487153 0.033937
- RespStatus 200
- RespStatus 200
- Debug "RES_MODE 18"
- Debug "Write error, retval = -1, len = 49669, errno = Broken pipe"
- BereqURL /dynamic-partials/partial/esiContent
- Timestamp Beresp: 1564555495.791766 0.021904 0.021765
- BereqURL /dynamic-partials/partial/esiContent
- Timestamp Beresp: 1564555495.819690 0.016104 0.015946
- Timestamp Fetch: 1564555495.824975 10.807900 0.026409
- RespStatus 200
- RespStatus 200
- Debug "RES_MODE 18"
- Debug "Write error, retval = -1, len = 49669, errno = Broken pipe"
- BereqURL /dynamic-partials/partial/esiContent
- Timestamp Beresp: 1564555495.847497 0.013608 0.013402
- Timestamp Fetch: 1564555495.860672 18.853275 0.035649
- RespStatus 200
Thanks to this output we figured out two important facts:
Now everything started to make sense:
Now that the reason was finally found and understood, what could we do about it? We needed to find a way to "free" Varnish of its internal queuing and tried to solve this in the Nginx before Varnish. Instead of passing /dynamic-partials to Varnish, we would skip Varnish and go straight to HAProxy behind Varnish. But this didn't work because Varnish itself handled the ESI block processing (the request to /dynamic-partials never came from the client, remember?).
While we evaluated possible next steps, we received a hint to take a look at "pipe". And that's what we did. A good explanation can be found on this Stackoverflow question: What is Pipe mode and pass mode in varnish:
Pass mode is very common in Varnish, and just tells Varnish to pass the request to the backend rather than try and serve it from cache.
Pipe mode is quite different and is rarely used. If you want to stream objects, such as videos, you'll want to use pipe to avoid timeouts. Using pipe means Varnish stops inspecting each request, and just sends bytes straight to the backend.
Sounds like we want to use pipe to speed up the processing.
One if condition more in the VCL (in vcl_recv):
# pipe requests to dynamic-partials directly to backend
if (req.url ~ "^/dynamic-partials") {
return(pipe);
}
Restart Varnish and stress-testing again:
root@server:~# siege -H "Host: nzzas-test.nzz.ch" -c 250 -b http://localhost:7081/ -v
[...]
HTTP/1.1 200 0.03 secs: 51040 bytes ==> GET /
HTTP/1.1 200 0.03 secs: 51040 bytes ==> GET /
HTTP/1.1 200 0.03 secs: 51040 bytes ==> GET /
HTTP/1.1 200 0.03 secs: 51040 bytes ==> GET /
HTTP/1.1 200 0.03 secs: 51040 bytes ==> GET /
HTTP/1.1 200 0.03 secs: 51040 bytes ==> GET /
HTTP/1.1 200 0.03 secs: 51040 bytes ==> GET /
HTTP/1.1 200 0.03 secs: 51040 bytes ==> GET /
HTTP/1.1 200 0.04 secs: 51040 bytes ==> GET /
HTTP/1.1 200 0.04 secs: 51040 bytes ==> GET /
HTTP/1.1 200 0.04 secs: 51040 bytes ==> GET /
HTTP/1.1 200 0.04 secs: 51040 bytes ==> GET /
HTTP/1.1 200 0.04 secs: 51040 bytes ==> GET /
HTTP/1.1 200 0.04 secs: 51040 bytes ==> GET /
HTTP/1.1 200 0.04 secs: 51040 bytes ==> GET /
HTTP/1.1 200 0.04 secs: 51040 bytes ==> GET /
HTTP/1.1 200 0.04 secs: 51040 bytes ==> GET /
HTTP/1.1 200 0.04 secs: 51040 bytes ==> GET /
HTTP/1.1 200 0.04 secs: 51040 bytes ==> GET /
HTTP/1.1 200 0.04 secs: 51040 bytes ==> GET /
HTTP/1.1 200 0.04 secs: 51040 bytes ==> GET /
^C
Lifting the server siege... done.
Transactions: 57123 hits
Availability: 100.00 %
Elapsed time: 14.66 secs
Data transferred: 2782.68 MB
Response time: 0.06 secs
Transaction rate: 3896.52 trans/sec
Throughput: 189.81 MB/sec
Concurrency: 228.28
Successful transactions: 57123
Failed transactions: 0
Longest transaction: 3.14
Shortest transaction: 0.00
Wow, what a difference. Even after running for longer than 10s, the response time staid the same (before the VCL change, an increasing value could already be seen after a few seconds)!
What did varnishlog say now?
root@server:~# varnishlog -n varnish-instance | egrep "(BereqURL|^- Debug|RespStatus|Timestamp.*Beresp:|Timestamp.*Fetch:)"
[...]
- RespStatus 200
- Debug "RES_MODE 18"
- RespStatus 200
- Debug "RES_MODE 18"
- RespStatus 200
- Debug "RES_MODE 18"
- RespStatus 200
- Debug "RES_MODE 18"
- RespStatus 200
- Debug "RES_MODE 18"
- Debug "Write error, retval = -1, len = 49668, errno = Broken pipe"
- RespStatus 200
- Debug "RES_MODE 18"
- Debug "Write error, retval = -1, len = 49668, errno = Broken pipe"
- RespStatus 200
- Debug "RES_MODE 18"
- RespStatus 200
- Debug "RES_MODE 18"
- RespStatus 200
- Debug "RES_MODE 18"
- Debug "Write error, retval = -1, len = 49668, errno = Broken pipe"
- RespStatus 200
- Debug "RES_MODE 18"
- Debug "Write error, retval = -1, len = 49668, errno = Broken pipe"
[...]
The write errors were shown again, when siege was killed. Which is normal and expected. But more importantly: The varnishlog output is much more calm! There are no backend request to for /dynamic-partials logged anymore. Which means: Varnish stopped doing internal processing and logging for this path and became much faster!

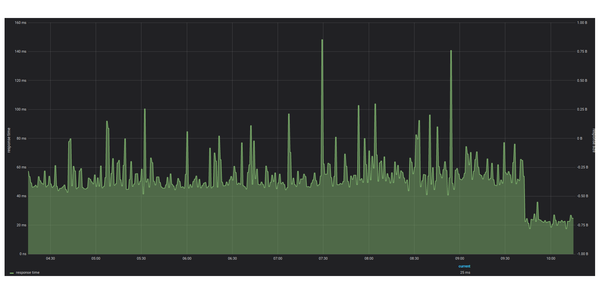
The "pipe" function did indeed fix this issue! But not only this - a positive side effect was that the page speed increased heavily. The response time of this web application dropped significantly since the VCL was adjusted:
Technically we learned about the pipe function and how it can help for non-cacheable data. But what is even more important is the fact that Developers and System Engineers need to sit together and discuss the architecture of the application. Only if all parties (and systems) involved understand how the application works and what kind of content is served under which paths, can systems like Varnish be tuned.
Although we've received the confirmation from the developers that the ESI blocks with personalized data were working correctly after the "pipe change", it turned out that personalized ESI content didn't turn up at all for the end user. By looking closer with varnishlog, we found out that Varnish throughs an error when the /dynamic-partials path would be used as an include:
root@server:~# varnishlog -n varnish-instance -i ReqUrl,VCL_*,Beresp*,TTL
* << Request >> 32772
- ReqURL /dynamic-partials/partial/esiContent
- ReqURL /dynamic-partials/partial/esiContent
- VCL_call RECV
- VCL_return pipe
- VCL_call HASH
- VCL_return lookup
- VCL_Error vcl_recv{} returns pipe for ESI included object. Doing pass.
According to the source code of VCL_RET_PIPE, ESI content should not accept the pipe function, but must use pass instead:
case VCL_RET_PIPE:
if (!IS_TOPREQ(req)) {
VSLb(req->vsl, SLT_VCL_Error,
"vcl_recv{} returns pipe for ESI included object."
" Doing pass.");
req->req_step = R_STP_PASS;
} else if (req->http0->protover > 11) {
However an automatic pass (R_STP_PASS) didn't seem to work. Only by manually changing the VCL to use pass instead of pipe, the personalized ESI content appeared to the end user.
The stress testing revealed that pass was not as fast as pipe, but still much faster than without the if condition for the /dynamic-partials path and we were not able to break Varnish.
No comments yet.

AI AWS Android Ansible Apache Apple Atlassian BSD Backup Bash Bluecoat CMS Chef Cloud Coding Consul Containers CouchDB DB DNS Databases Docker ELK Elasticsearch Filebeat FreeBSD Galera Git GlusterFS Grafana Graphics HAProxy HTML Hacks Hardware Icinga Influx Internet Java KVM Kibana Kodi Kubernetes LVM LXC Linux Logstash Mac Macintosh Mail MariaDB Minio MongoDB Monitoring Multimedia MySQL NFS Nagios Network Nginx OSSEC OTRS Observability Office OpenSearch PHP Perl Personal PostgreSQL PowerDNS Proxmox Proxy Python Rancher Rant Redis Roundcube SSL Samba Seafile Security Shell SmartOS Solaris Surveillance Systemd TLS Tomcat Ubuntu Unix VMware Varnish Virtualization Windows Wireless Wordpress Wyse ZFS Znuny Zoneminder