
The last post (Monitoring Varnish with check_varnish and create graphs from multiple varnishstat fields), described how the monitoring plugin check_varnish can be used to query multiple fields from varnishstat and use them as performance data for a monitoring software.
With the basis of check_varnish, it's time to create service checks for Varnish instances and create a fancy dashboard in Grafana!
Let's start with a single service check to understand how to implement check_varnish. In this case NRPE is used as remote executor because the plugin runs on a remote host where Varnish is installed.
Note: You can of course use an alternative remote plugin execution solution if you don't fancy NRPE.
The NRPE command definitions on the Varnish server contain two entries:
command[check_varnish]=sudo /usr/lib/nagios/plugins/check_varnish.py -f $ARG1$
command[check_varnish_name]=sudo /usr/lib/nagios/plugins/check_varnish.py -f $ARG1$ -n $ARG2$
The first command, [check_varnish], is used in case there's only one Varnish instance running on this particular server. If there are multiple Varnish instances running, the second command, [check_varnish_name] can be used.
If you use Nagios or a fork of it, the service definition would look like this:
define service{
use generic-service
host_name myvarnish
service_description Varnish Stats
check_command check_nrpe!check_varnish!"SMA.s0.g_bytes,MAIN.backend_fail,MAIN.backend_busy,MAIN.losthdr,MAIN.sess_dropped,MAIN.sess_conn,MAIN.client_req,MAIN.cache_hit,MAIN.cache_miss,MAIN.sess_queued,MAIN.esi_errors,MAIN.n_lru_nuked"
}
In Icinga 2 the service object could look like this:
# check varnish stats
object Service "Varnish Stats" {
import "generic-service"
host_name = "myvarnish"
check_command = "nrpe"
vars.nrpe_command = "check_varnish"
vars.nrpe_arguments = [ "SMA.s0.g_bytes,MAIN.backend_fail,MAIN.backend_busy,MAIN.losthdr,MAIN.sess_dropped,MAIN.sess_conn,MAIN.client_req,MAIN.cache_hit,MAIN.cache_miss,MAIN.sess_queued,MAIN.esi_errors,MAIN.n_lru_nuked" ]
}
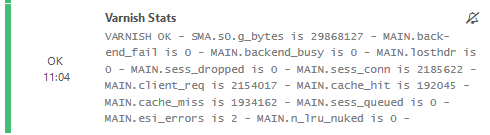
Once correctly installed, the service should appear in Icingaweb2 and start saving performance data into the background database (whatever defined):
Varnish supports to run multiple instances of Varnish, each with its own listening ports and own VCL's (if wanted). This can be achieved by using the "-n" parameter. According to the output of varnishd --help this parameter stands for "work dir" and refers to a dedicated sub-directory in /var/lib/varnish; however a better description would actually be "named instance" or "namespace".
Here's an example of multiple Varnish instances running alongside on the same server:
$ ps aux|grep varnish
vcache 5237 0.0 0.0 58060 6316 ? SLs Feb18 0:10 /usr/sbin/varnishd -j unix,user=vcache -n varnish-baum -F -a :7095 -T localhost:7096 -f /etc/varnish/baum.vcl -S /etc/varnish/secret -s malloc,128m
vcache 5250 0.0 0.0 58060 6244 ? SLs Feb18 0:10 /usr/sbin/varnishd -j unix,user=vcache -n varnish-delivery -F -a :7071 -T localhost:7072 -f /etc/varnish/delivery.vcl -S /etc/varnish/secret -s malloc,4096m
vcache 5276 0.0 0.0 58060 6256 ? SLs Feb18 0:09 /usr/sbin/varnishd -j unix,user=vcache -n varnish-elnino -F -a :7093 -T localhost:7094 -f /etc/varnish/elnino.vcl -S /etc/varnish/secret -s malloc,4096m
In this case we've got three instances on this server: varnish-baum, varnish-delivery and varnish-elnino.
To monitor these named instances, the prepared NRPE command [check_varnish_name] can be used. Here the service object example for Icinga 2:
object Service "Varnish Stats Elnino" {
import "generic-service"
host_name = "myvarnish"
check_command = "nrpe"
vars.nrpe_command = "check_varnish_name"
vars.nrpe_arguments = [
"SMA.s0.g_bytes,MAIN.backend_fail,MAIN.backend_busy,MAIN.losthdr,MAIN.sess_dropped,MAIN.sess_conn,MAIN.client_req,MAIN.cache_hit,MAIN.cache_miss,MAIN.sess_queued,MAIN.esi_errors,MAIN.n_lru_nuked", "varnish-elnino"
]
}
Now that it is known, how to add a Varnish service check, the next step is to apply such services automatically to hosts running one or more Varnish instances! To do this, Icinga 2's killer feature "apply rules" can be used.
A couple of older but nevertheless informative articles about apply rules:
In this example a custom variable "vars.varnish", in form of a dictionary, is set inside the host object:
object Host "myvarnish1" {
import "generic-host"
address = "192.168.44.41"
# Varnish instances
vars.varnish["Varnish"] = { }
}
object Host "myvarnish2" {
import "generic-host"
address = "192.168.44.44"
# Varnish instances
vars.varnish["Elnino"] = { "name" = "varnish-elnino" }
vars.varnish["Baum"] = { "name" = "varnish-baum" }
vars.varnish["Delivery"] = { "name" = "varnish-delivery" }
}
The apply rule is pretty straightforward and handles both cases of a single or multiple Varnish instance running on a host:
apply Service "Varnish Stats " for (instance => config in host.vars.varnish) {
import "service-60s-dontcare"
display_name = "Varnish Stats"
vars =+ config
vars.stats = "SMA.s0.g_bytes,MAIN.backend_fail,MAIN.backend_busy,MAIN.losthdr,MAIN.sess_dropped,MAIN.sess_conn,MAIN.client_req,MAIN.cache_hit,MAIN.cache_miss,MAIN.sess_queued,MAIN.esi_errors,MAIN.n_lru_nuked"
check_command = "nrpe"
if (vars.name) {
display_name = "Varnish Stats " + instance
vars.nrpe_command = "check_varnish_name"
vars.nrpe_arguments = [ vars.stats, vars.name ]
} else {
vars.nrpe_command = "check_varnish"
vars.nrpe_arguments = [ vars.stats ]
}
vars.influx_append = "_check_varnish"
assign where host.address && host.vars.varnish
}
vars.stats is a variable containing all the varnishstat fields which should be checked (this could of course also come from the dictionary).
The if condition (if (vars.name)) inside the apply rule checks whether or not the "name" variable was defined inside the dictionary. If it was set, this means that the Varnish instance needs to be checked using the -n parameter of the check_varnish plugin and uses the [check_varnish_name] NRPE command. If no "name" variable was defined, the apply rule assumes the host runs a single Varnish instance, therefore no -n parameter is necessary and [check_varnish] is used.
vars.influx_append refers to a hack (see article Create separate measurement tables in InfluxDB for Icinga 2 NRPE checks) to make sure a dedicated measurement table is used for all check_varnish checks.
In the example above a dictionary is used to define the Varnish instances. This allows to add additional variables for each Varnish instance (for example listening port, specific stats to be checked, etc). If dictionaries are too complicated (but usually it's worth it!) an alternative could be to use a simple array in which all the instances are defined:
object Host "myvarnish2" {
import "generic-host"
address = "192.168.44.44"
# Named Varnish instances
vars.varnish = [ "Elnino", "Baum", "Delivery" ]
}
The corresponding apply rule could then look like this:
apply Service "Varnish Stats " for (instance in host.vars.varnish) {
import "service-60s-dontcare"
display_name = "Varnish Stats " + instance
vars.stats =
"SMA.s0.g_bytes,MAIN.backend_fail,MAIN.backend_busy,MAIN.losthdr,MAIN.sess_dropped,MAIN.sess_conn,MAIN.client_req,MAIN.cache_hit,MAIN.cache_miss,MAIN.sess_queued,MAIN.esi_errors,MAIN.n_lru_nuked"
check_command = "nrpe"
vars.nrpe_command = "check_varnish_name"
vars.nrpe_arguments = [ vars.stats, vars.name ]
vars.influx_append = "_check_varnish"
assign where host.address && host.vars.varnish
}
But to keep the possibility open to add more service checks based on the additional variables in the dictionary, using dictionaries is recommended.
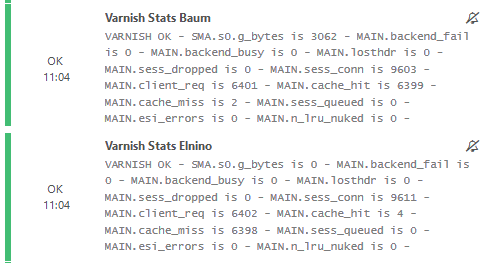
If all was correctly configured, Icinga 2 should apply the Varnish Stats service checks to the hosts which have "vars.varnish" defined in the host definition. In Icingaweb2 this then looks like this:
Now that all Varnish stats from all instances are written into the same InfluxDB measurement table (in our case nrpe_check_varnish), a dashboard and graph can be built with Grafana. To make the graph as dynamic as possible, multiple variables are defined.
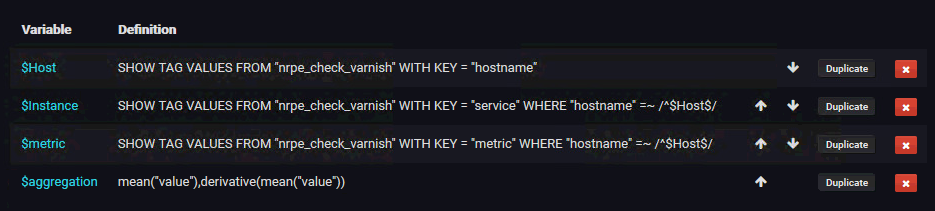
$Host: This variable queries the hostname tag in the nrpe_check_varnish measurement. Only hosts which actually have Varnish statistics should be able to be selected in the dashboard:
SHOW TAG VALUES FROM "nrpe_check_varnish" WITH KEY = "hostname"
$Instance: Pretty much the same as $Host, but here the Varnish instance names from the chosen $Host should appear.
SHOW TAG VALUES FROM "nrpe_check_varnish" WITH KEY = "service" WHERE "hostname" =~ /^$Host$/
To display the instance name a little bit nicer (instead of "Varnish Stats Baum"), a regex can be added to only display the Varnish name:
Regex: /^Varnish Stats (.*)$/
Multi-value and include all option are enabled. This allows to use multiple graphs of multiple or even all Varnish instances.
$metric: Selects all the available metrics (the fields from check_varnish's performance data) from the selected $Host and the selected $Instance. Remember, there can be multiple instances selected. Also in this case several metrics will show up and they, too, should be able to be shown in the same graph. Therefore multi-value and include all option is selected here, too.
$aggregation: This variable is not required but as all the values from varnishstat are counters, they increase until Varnish was restarted. The Grafana default is to use "mean("value")" to continuously grow the graph. However if one wants to figure out if at a certain time there was a faster counter increase than normal, derivative should be used. This value is a custom value and allows the selection of either one of:
mean("value"),derivative(mean("value"))
To build a dynamic graph using the variables, the query to create the stats graph must use the correct Influx query language to represent the selected variables. And also the aggregation must be considered at the beginning. The full query could look like this:
SELECT $aggregation FROM "nrpe_check_varnish" WHERE ("hostname" =~ /^$Host$/ AND "metric" =~ /^$metric$/ AND "service" =~ /$Instance$/) AND $timeFilter GROUP BY time($__interval), "metric", "service" fill(linear)
Note that "service" =~ /$Instance$/ is using the selected value(s) of dashboard variable "Instance" as a "light" regular expression, not as a fixed regex (see the missing ^).
The graph should also use "Alias By" and use "$tag_service $tag_metric" to quickly identify multiple selected variables.
Time to see the results! Here a full graph with multiple Varnish instances selected using all metrics:
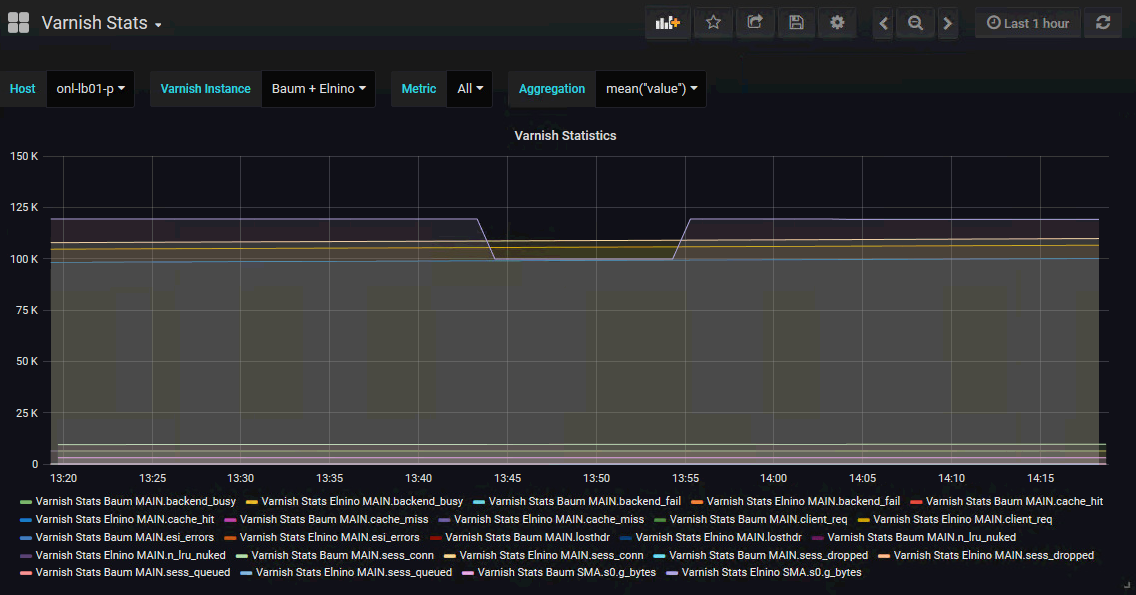
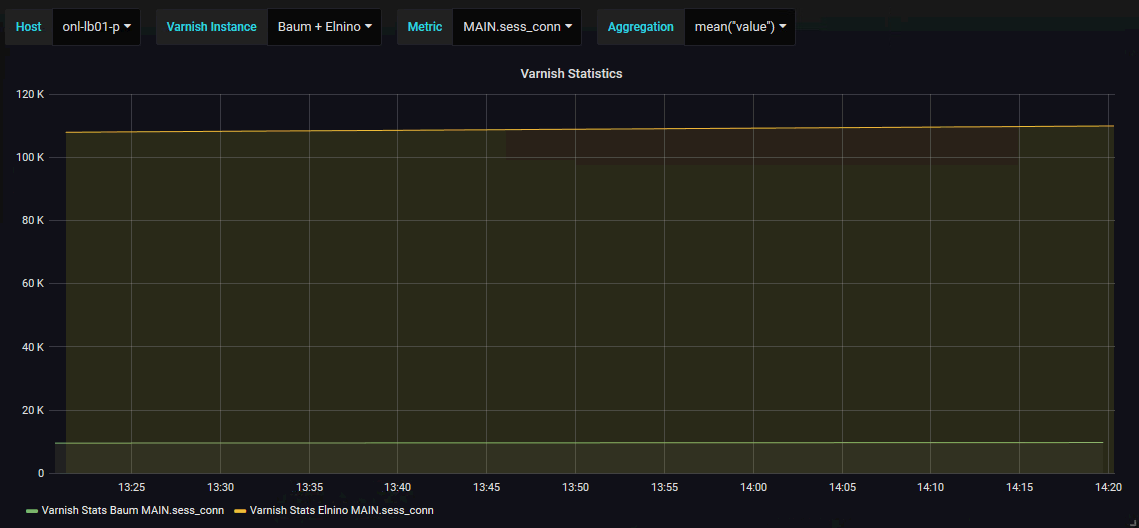
By selecting a metric (here MAIN.sess_conn), multiple Varnish instances can be easily compared:
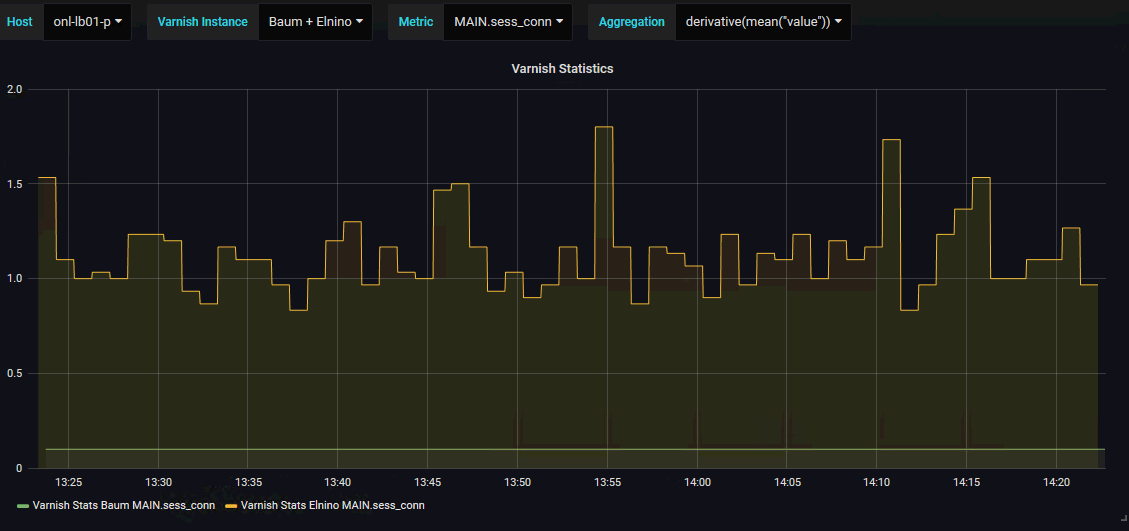
By changing the aggregation type to derivative, spikes can be identified much quicker:
You want. You may have. Here's the json which can be used to import a dashboard into Grafana:
{
"annotations": {
"list": [
{
"$$hashKey": "object:153",
"builtIn": 1,
"datasource": "-- Grafana --",
"enable": true,
"hide": true,
"iconColor": "rgba(0, 211, 255, 1)",
"name": "Annotations & Alerts",
"type": "dashboard"
}
]
},
"description": "Grafana dashboard to show Varnish statistics from check_varnish plugin by claudiokuenzler.com",
"editable": true,
"gnetId": null,
"graphTooltip": 0,
"id": 13,
"iteration": 1582203003855,
"links": [],
"panels": [
{
"aliasColors": {},
"bars": false,
"dashLength": 10,
"dashes": false,
"datasource": null,
"fill": 1,
"gridPos": {
"h": 12,
"w": 24,
"x": 0,
"y": 0
},
"id": 2,
"legend": {
"alignAsTable": false,
"avg": false,
"current": false,
"max": false,
"min": false,
"rightSide": false,
"show": true,
"total": false,
"values": false
},
"lines": true,
"linewidth": 1,
"links": [],
"minSpan": null,
"nullPointMode": "null",
"percentage": false,
"pointradius": 5,
"points": false,
"renderer": "flot",
"repeat": null,
"repeatDirection": "v",
"seriesOverrides": [],
"spaceLength": 10,
"stack": false,
"steppedLine": false,
"targets": [
{
"$$hashKey": "object:523",
"alias": "$tag_service $tag_metric",
"groupBy": [
{
"params": [
"$__interval"
],
"type": "time"
},
{
"params": [
"metric"
],
"type": "tag"
},
{
"params": [
"$Instance"
],
"type": "tag"
},
{
"params": [
"previous"
],
"type": "fill"
}
],
"measurement": "nrpe_check_varnish",
"orderByTime": "ASC",
"policy": "default",
"query": "SELECT $aggregation FROM \"nrpe_check_varnish\" WHERE (\"hostname\" =~ /^$Host$/ AND \"metric\" =~ /^$metric$/ AND \"service\" =~ /$Instance$/) AND $timeFilter GROUP BY time($__interval), \"metric\", \"service\" fill(linear)",
"rawQuery": true,
"refId": "A",
"resultFormat": "time_series",
"select": [
[
{
"params": [
"value"
],
"type": "field"
},
{
"params": [],
"type": "mean"
}
]
],
"tags": [
{
"key": "hostname",
"operator": "=~",
"value": "/^$Host$/"
},
{
"condition": "AND",
"key": "metric",
"operator": "=~",
"value": "/^$metric$/"
},
{
"condition": "AND",
"key": "service",
"operator": "=~",
"value": "/^$Instance$/"
}
]
}
],
"thresholds": [],
"timeFrom": null,
"timeShift": null,
"title": "Varnish Statistics",
"tooltip": {
"shared": true,
"sort": 0,
"value_type": "individual"
},
"transparent": true,
"type": "graph",
"xaxis": {
"buckets": null,
"mode": "time",
"name": null,
"show": true,
"values": []
},
"yaxes": [
{
"format": "short",
"label": null,
"logBase": 1,
"max": null,
"min": null,
"show": true
},
{
"format": "short",
"label": null,
"logBase": 1,
"max": null,
"min": null,
"show": true
}
],
"yaxis": {
"align": false,
"alignLevel": null
}
}
],
"schemaVersion": 16,
"style": "dark",
"tags": [],
"templating": {
"list": [
{
"allValue": null,
"current": {
"text": "onl-lb01-p",
"value": "onl-lb01-p"
},
"datasource": "icinga",
"hide": 0,
"includeAll": false,
"label": null,
"multi": false,
"name": "Host",
"options": [],
"query": "SHOW TAG VALUES FROM \"nrpe_check_varnish\" WITH KEY = \"hostname\"",
"refresh": 1,
"regex": "",
"sort": 0,
"tagValuesQuery": "",
"tags": [],
"tagsQuery": "",
"type": "query",
"useTags": false
},
{
"allValue": null,
"current": {
"tags": [],
"text": "All",
"value": [
"$__all"
]
},
"datasource": "icinga",
"hide": 0,
"includeAll": true,
"label": "Varnish Instance",
"multi": true,
"name": "Instance",
"options": [],
"query": "SHOW TAG VALUES FROM \"nrpe_check_varnish\" WITH KEY = \"service\" WHERE \"hostname\" =~ /^$Host$/",
"refresh": 1,
"regex": "/^Varnish Stats (.*)$/",
"sort": 0,
"tagValuesQuery": "",
"tags": [],
"tagsQuery": "instance",
"type": "query",
"useTags": false
},
{
"allValue": null,
"current": {
"tags": [],
"text": "All",
"value": [
"$__all"
]
},
"datasource": "icinga",
"hide": 0,
"includeAll": true,
"label": "Metric",
"multi": true,
"name": "metric",
"options": [],
"query": "SHOW TAG VALUES FROM \"nrpe_check_varnish\" WITH KEY = \"metric\" WHERE \"hostname\" =~ /^$Host$/",
"refresh": 1,
"regex": "",
"sort": 0,
"tagValuesQuery": "",
"tags": [],
"tagsQuery": "",
"type": "query",
"useTags": false
},
{
"allValue": null,
"current": {
"tags": [],
"text": "mean(\"value\")",
"value": "mean(\"value\")"
},
"hide": 0,
"includeAll": false,
"label": "Aggregation",
"multi": false,
"name": "aggregation",
"options": [
{
"$$hashKey": "object:632",
"selected": true,
"text": "mean(\"value\")",
"value": "mean(\"value\")"
},
{
"$$hashKey": "object:633",
"selected": false,
"text": "derivative(mean(\"value\"))",
"value": "derivative(mean(\"value\"))"
}
],
"query": "mean(\"value\"),derivative(mean(\"value\"))",
"type": "custom"
}
]
},
"time": {
"from": "now-1h",
"to": "now"
},
"timepicker": {
"refresh_intervals": [
"5s",
"10s",
"30s",
"1m",
"5m",
"15m",
"30m",
"1h",
"2h",
"1d"
],
"time_options": [
"5m",
"15m",
"1h",
"6h",
"12h",
"24h",
"2d",
"7d",
"30d"
]
},
"timezone": "",
"title": "Varnish Stats",
"uid": "rhxtA-QWz",
"version": 16
}
You may have to adjust the datasource and measurement table to match your own InfluxDB data structure.
No comments yet.

AI AWS Android Ansible Apache Apple Atlassian BSD Backup Bash Bluecoat CMS Chef Cloud Coding Consul Containers CouchDB DB DNS Databases Docker ELK Elasticsearch Filebeat FreeBSD Galera Git GlusterFS Grafana Graphics HAProxy HTML Hacks Hardware Icinga Influx Internet Java KVM Kibana Kodi Kubernetes LVM LXC Linux Logstash Mac Macintosh Mail MariaDB Minio MongoDB Monitoring Multimedia MySQL NFS Nagios Network Nginx OSSEC OTRS Observability Office OpenSearch PHP Perl Personal PostgreSQL PowerDNS Proxmox Proxy Python Rancher Rant Redis Roundcube SSL Samba Seafile Security Shell SmartOS Solaris Surveillance Systemd TLS Tomcat Ubuntu Unix VMware Varnish Virtualization Windows Wireless Wordpress Wyse ZFS Znuny Zoneminder