
The graphs must be wrong!
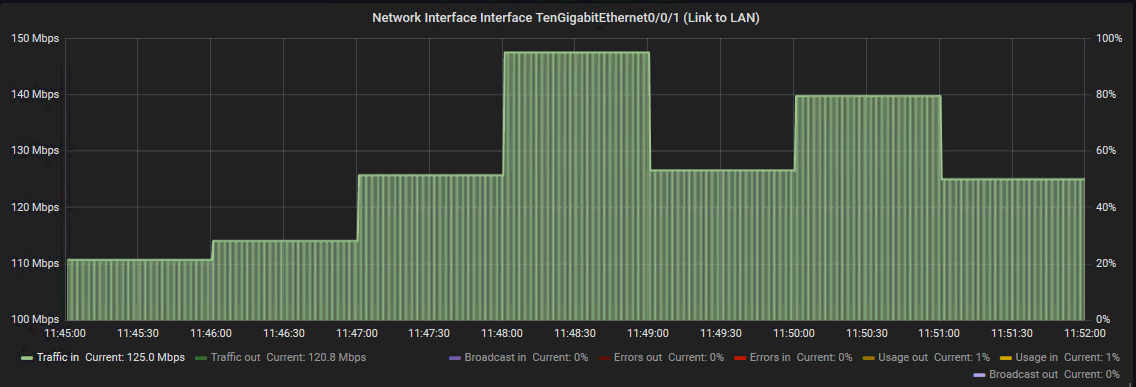
As a monitoring expert "living monitoring" (yes, this is my passion), this statement from a network administrator caught me by surprise. The graphs referred to interface traffic graphs shown in Grafana, using interface performance data written by check_nwc_health into an InfluxDB (via Icinga 2).
But nothing can be ruled out unless proven. So I decided to take a closer look at how check_nwc_health calculates the interface traffic.
When running check_nwc_health on the command line using the interface-usage mode, the following output is shown:
$ ./check_nwc_health --hostname=switch --statefilesdir=/tmp --protocol=2c --community=public --mode=interface-usage --name TenGigabitEthernet0/0/1
OK - interface TenGigabitEthernet0/0/1 (alias Link to LAN) usage is in:2.09% (209197071.70bit/s) out:0.91% (90867146.68bit/s) | 'TenGigabitEthernet0/0/1_usage_in'=2.09%;80;90;0;100 'TenGigabitEthernet0/0/1_usage_out'=0.91%;80;90;0;100 'TenGigabitEthernet0/0/1_traffic_in'=209197071.70;8000000000;9000000000;0;10000000000 'TenGigabitEthernet0/0/1_traffic_out'=90867146.68;8000000000;9000000000;0;10000000000
The plugin shows two relevant performance data here:
To dig in deeper, check_nwc_health provides different verbose levels by appending one or more -v parameters. This will show additional information directly coming from SNMP:
$ ./check_nwc_health --hostname=switch --statefilesdir=/tmp --protocol=2c --community=public --mode=interface-usage --name TenGigabitEthernet0/0/1 -vvv
[INTERFACESUBSYSTEM]
bootTime: 1535241918
duplicates: HASH(0x5741770)
ifCacheLastChange: 1584633871
ifTableLastChange: 1566825882.12
interface_cache: HASH(0x5745480)
info: checking interfaces
[64BIT_2]
delta_ifHCInOctets: 12851200579
delta_ifHCOutOctets: 6711710306
delta_ifInBits: 102809604632
delta_ifOutBits: 53693682448
delta_timestamp: 547
ifAlias: Link to LAN
ifDescr: TenGigabitEthernet0/0/1
ifHCInOctets: 974071772432616
ifHCInOctets_per_sec: 23493968.1517367
ifHCOutOctets: 619657250186324
ifHCOutOctets_per_sec: 12270037.1224863
ifHighSpeed: 10000
ifInOctets: 3254470888
ifIndex: 2
ifName: Te0/0/1
ifOperStatus: up
ifOutOctets: 843555924
ifSpeed: 4294967295
inputRate: 187951745.213894
inputUtilization: 1.87951745213894
maxInputRate: 10000000000
maxOutputRate: 10000000000
outputRate: 98160296.9798903
outputUtilization: 0.981602969798903
info: interface TenGigabitEthernet0/0/1 (alias Link to LAN) usage is in:1.88% (187951745.21bit/s) out:0.98% (98160296.98bit/s)
OK - interface TenGigabitEthernet0/0/1 (alias Link to LAN) usage is in:1.88% (187951745.21bit/s) out:0.98% (98160296.98bit/s)
checking interfaces
interface TenGigabitEthernet0/0/1 (alias Link to LAN) usage is in:1.88% (187951745.21bit/s) out:0.98% (98160296.98bit/s) | 'TenGigabitEthernet0/0/1_usage_in'=1.88%;80;90;0;100 'TenGigabitEthernet0/0/1_usage_out'=0.98%;80;90;0;100 'TenGigabitEthernet0/0/1_traffic_in'=187951745.21;8000000000;9000000000;0;10000000000 'TenGigabitEthernet0/0/1_traffic_out'=98160296.98;8000000000;9000000000;0;10000000000
Thanks to the verbose output we can see that the inputRate and outputRate (highlighted in bold) are taken as actual interface speeds.
When looking at the plugin's source code, one can find the following relevant code parts in InterfaceSubsystem.pm in the "usage" part:
$self->valdiff({name => $self->{ifIndex}.'#'.$self->{ifDescr}}, qw(ifInOctets ifOutOctets));
$self->{delta_ifInBits} = $self->{delta_ifInOctets} * 8;
$self->{delta_ifOutBits} = $self->{delta_ifOutOctets} * 8;
[...]
$self->{inputRate} = $self->{delta_ifInBits} / $self->{delta_timestamp};
$self->{outputRate} = $self->{delta_ifOutBits} / $self->{delta_timestamp};
First let's try to explain the valdiff function: When the plugin runs, it writes a file into the "statefilesdir" (defaults to /tmp/) using the target hostname and interface as filename. Inside this file, the interface's traffic performance data is saved along the timestamp of the check:
$ cat "/tmp/switch_device::interfaces::usage_2#tengigabitethernet0_0_123cf4a9df48212f44"
$VAR1 = {
'timestamp' => 1584634579,
'localtime' => 'Thu Mar 19 17:16:19 2020',
'ifHCInOctets' => '974071772432616',
'ifHCOutOctets' => '619657250186324'
};
When the plugin does the same check on the same interface again, valdiff is launched: The previous data is compared with the new collected data and a difference (hence valdiff = value difference) is calculated and stored as "delta" variables. The octet deltas are multiplied by 8 to get the same value in Bit (1 Octet = 8 Bit).
Now to something tricky: How does the plugin correctly determine the speed in Bits/second? When the plugin runs the same check every second on an interface, the Bits/second make sense. But what about running the plugin every 5 minutes or even once an hour? That's why the stored timestamp in the temp file is so important! The current and the stored timestamp are compared and yet another delta (= time difference) is calculated. And using this time difference as divider results in the final Bits/second values - which finally are stored in the previously mentioned inputRate and outputRate variables (which can be seen in the verbose output).
And, you probably guessed it, the temp file is rewritten with the now new data and waiting for the next run for comparison and valdiff calculations.
$ cat "/tmp/switch_device::interfaces::usage_2#tengigabitethernet0_0_123cf4a9df48212f44"
$VAR1 = {
'ifHCInOctets' => '974114105928875',
'timestamp' => 1584636386,
'localtime' => 'Thu Mar 19 17:46:26 2020',
'ifHCOutOctets' => '619679721786303'
};
Note: ifHCInOctets and ifHCOutOctets are 64bit SNMP counters. Compared to 32bit counters (ifInOctets and ifOutOctets) they can hold much larger numbers. On long-running network devices with a lot of traffic it is mandatory to use the 64bit counters or you will get incorrect traffic data.
To rule out a potential bug in valdiff or another part of the plugin, the raw SNMP counter values were taken and traffic calculations were created. The plugin was run once a minute using a while loop, sleeping 60s in between:
$ while true; do date; ./check_nwc_health --hostname=switch --statefilesdir=/tmp --protocol=2c --community=public --mode=interface-usage --name TenGigabitEthernet0/0/1 -vvv | egrep "(ifHCInOctets|ifInOctets|inputRate)"; sleep 60; echo "---------"; done
Example output:
Thu Mar 19 11:45:03 CET 2020
delta_ifHCInOctets: 60840931786
ifHCInOctets: 973732081243736
ifHCInOctets_per_sec: 21830258.983136
ifInOctets: 2865698392
inputRate: 174642071.865088
-------
Thu Mar 19 11:46:04 CET 2020
delta_ifHCInOctets: 855553551
ifHCInOctets: 973732936797287
ifHCInOctets_per_sec: 14259225.85
ifInOctets: 3721251943
inputRate: 114073806.8
The raw data was taken into a spread sheet and Mbit/s calculations were used on the following fields:
The results talk for themselves:
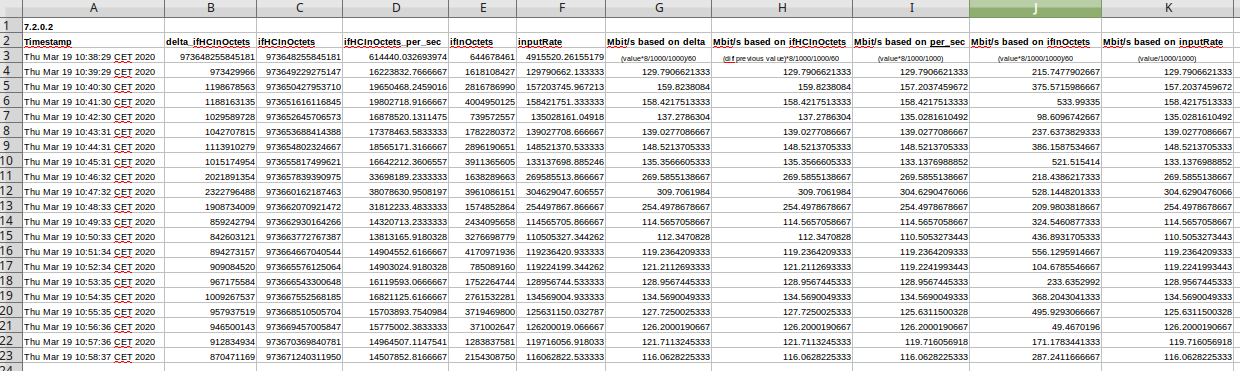
The manually calculated Mbit/s traffic using the raw ifHCInOctets matched the speed calculated from inputRate. Only the 32bit counter (ifInOctets) showed different Mbit/s data, but this is because the counter probably ran out of its 32bit limitation to continue storing data.
Columns G (Mbit/s based on the plugin's delta) and H (manual calculation from raw data) always matched.
One certain lines the columns G/H and I (Mbit/s based on ifHCInOctets_per_sec SNMP value) differed. But column K (Mbit/s based on the inputRate from the plugin) always matched column I. The difference between non-matching lines however was not as big.
So at the end the plugin's interface statistics turned out to be completely correct and so did the Grafana graphs!
No comments yet.

AI AWS Android Ansible Apache Apple Atlassian BSD Backup Bash Bluecoat CMS Chef Cloud Coding Consul Containers CouchDB DB DNS Databases Docker ELK Elasticsearch Filebeat FreeBSD Galera Git GlusterFS Grafana Graphics HAProxy HTML Hacks Hardware Icinga Influx Internet Java KVM Kibana Kodi Kubernetes LVM LXC Linux Logstash Mac Macintosh Mail MariaDB Minio MongoDB Monitoring Multimedia MySQL NFS Nagios Network Nginx OSSEC OTRS Observability Office OpenSearch PHP Perl Personal PostgreSQL PowerDNS Proxmox Proxy Python Rancher Rant Redis Roundcube SSL Samba Seafile Security Shell SmartOS Solaris Surveillance Systemd TLS Tomcat Ubuntu Unix VMware Varnish Virtualization Windows Wireless Wordpress Wyse ZFS Znuny Zoneminder