
The more important a service is, the more often such a service needs to be measured by its availability. This leads to so-called SLA (Service Level Agreement) reporting where the promised availability is compared with the real availability.
The open source monitoring dinosaur Nagios offered this possibility since a very early release. It featured an avail.cgi script (embedded in the user interface and accessible via http) which allowed to retrieve availability statistics for hosts, services and even groups of these. When using the correct URL and parameters, this script could also be used to create automated availability statistics and reports (see article How to create automatic PDF from Nagios Availability Reports?).
When Icinga was released, it was initially a fork of Nagios. It offered a similar user interface (with a different design) but with the same scripts in the background. The availability report script avail.cgi was still available. But with Icinga 2, this story changed.
In Icinga 2 releases before 2.10, the so-called icinga2-classicui could be installed alongside icinga2. This meant that the monitoring core application was updated with a new fancy monitoring software, but the same old (yet stable and working) user interface could be used. SLA statistics and reports could still be created using avail.cgi. See article Automatic SLA reporting from Icinga and push into Confluence page for an example how this could be achieved.
As the classicui was forked from Nagios, it would be a matter of time until the code changes between the core (Icinga 2) and the user interfaces (Icingaweb and Classic-UI) would eventually shift apart. With Icinga 2 2.10, the classic-ui package was gone (see Icinga2-classicui is gone after installing Icinga2 2.10) and with it the possibility to create manual or automated SLA reports.
Indeed! There's a module for Icingaweb in the works which is called "reporting", or "icingaweb2-module-reporting" with full name. The guys at Icinga know that the most requested "feature" is and has always been a SLA/reporting tool. Releasing a monitoring software without the possibility to display availability statistics is like a car without a radio/multimedia player; everything works but something is missing. And seriously, who wouldn't go nuts in a car without radio or music?
During the OSMC (Open Source Monitoring Conference) 2018, it was already announced that there will soon be a module to create reports. In June 2019 it finally seemed to be the case: The repository for "icingaweb2-module-reporting" appeared on GitHub.
The module itself is very basic and creating reports, but it seems to be doing what it is supposed to do:
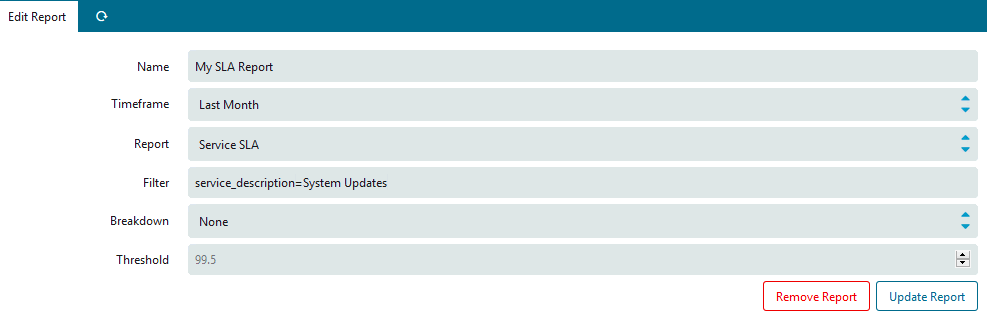
However, the lack of selecting Hosts, Services or Groups and the lack of selecting a monitoring period (e.g. "24x7", "businesshours", etc) feels stripped - especially when comparing with the previous possibilities from the classicui.
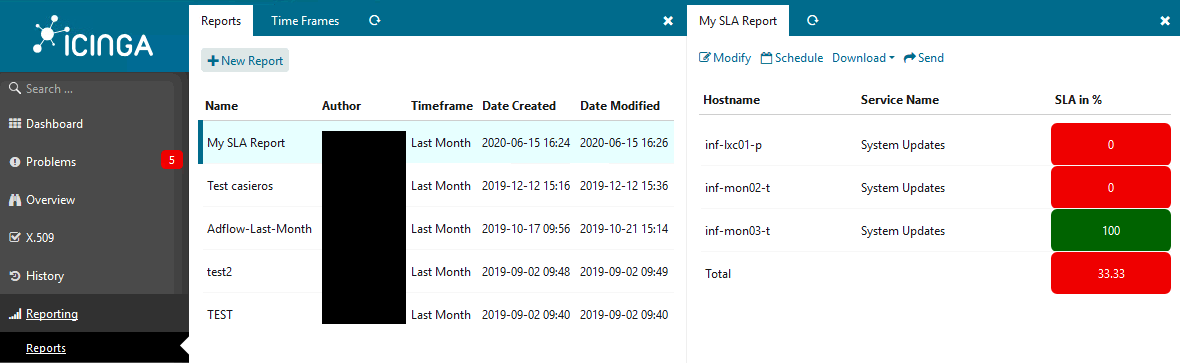
The created report does what it should do: The relevant services (here all services matching "System Updates") are measured on their availability during the last month and are listed in the report. At the end of the report a Total value is shown, which holds the aggregated value of all the services in the list. The reporting module basically adds the availability of each service and divides it by the number of services in that report: Voilà you got an average.
So far so good, but what about automated reports?
Each report can be exported/downloaded using three methods (where id is the report ID):
For obvious reasons, CSV and Json would be the preferred way to parse the aggregated total availability of the report. But there's a huge downer: The downloaded report does not contain the "Total" value:
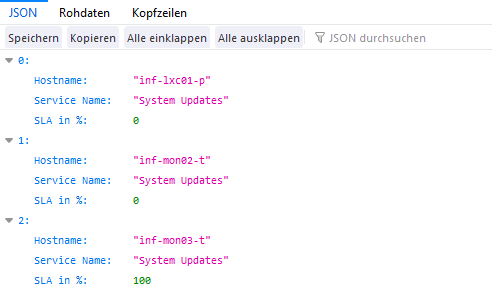
Yes, the calculation could be made by a parsing script. But would it hurt to add a meta field outside of the array containing the total availability? Probably not. A feature request for this missing field was created.
As the reporting module for Icingaweb (in version 0.9.2) is not yet there where it should be (again, compared to the previous possibilities), another possibility can be used: Thruk.
Thruk is another user interface which reminds of the original Nagios and the Icinga 2 classic user interfaces. The big difference here is that Thruk itself is not a monitoring software, but rather a pure user interface (without monitoring core). It is however able to communicate with different and even multiple monitoring servers such as Nagios, Naemon, Shinken and even Icinga 2 through Livestatus.
Thruk itself also has a couple of plugins. One of these plugins is the "reports2" plugin. It is specifically written to create SLA reports.
When creating a report, a large input form opens and the user has a lot of options to chose from. The form itself kind of remind of the old avail.cgi script, but with even more possibilities and flexibility.
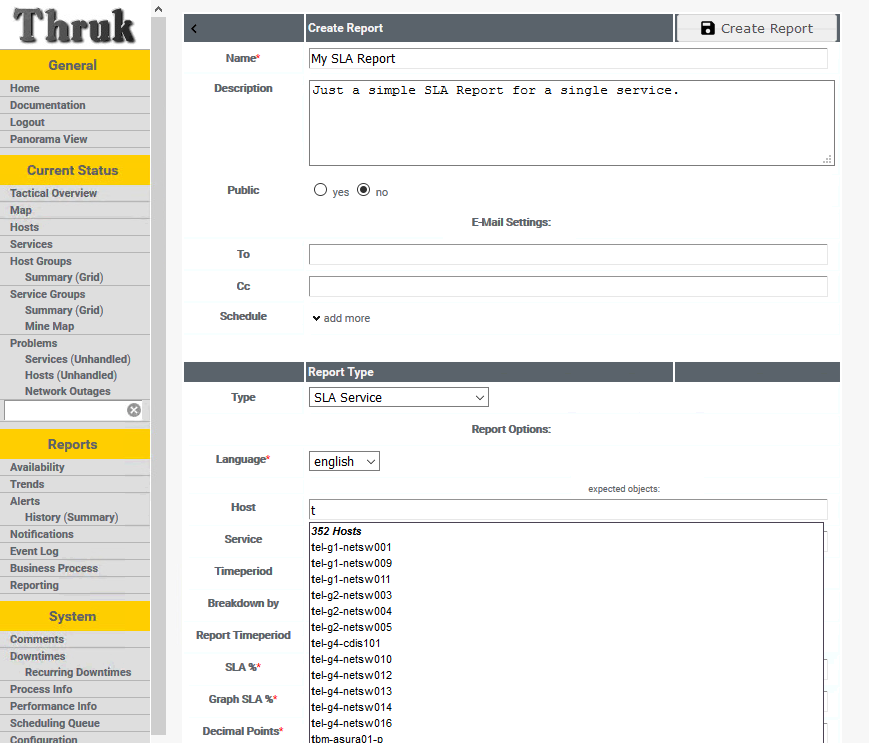
Using the Livestatus backend from Icinga 2, the host, service and group objects can be selected from a generated drop-down list. This is pretty handy and helps to quickly create a SLA report.
Additional fields also allow to define which report timeperiod should be used, how the SLA should be displayed in the graph, what kind of states should be ignored, etc.
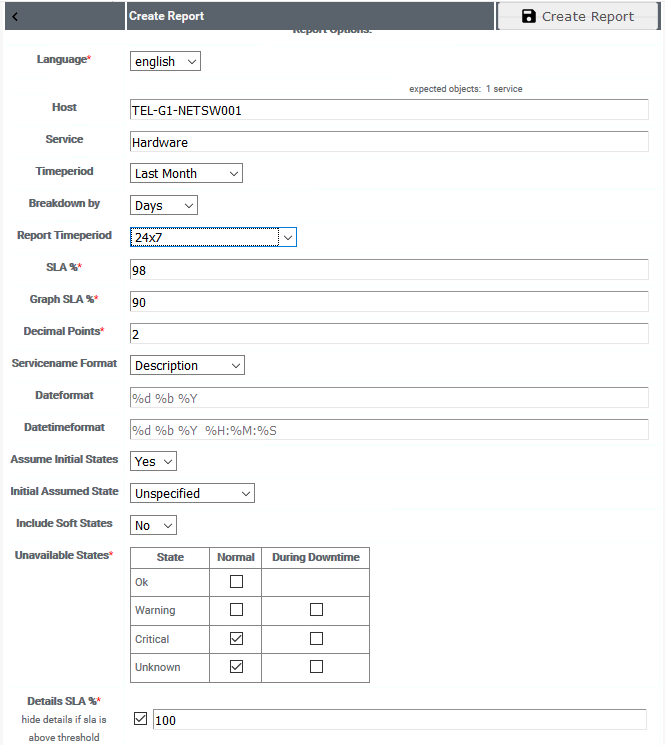
Important note when using Icinga 2: The "Initial Assumed State" should be manually set to "Service Ok" or the report might not be able to lookup the initial state, leading to wrong calculations.
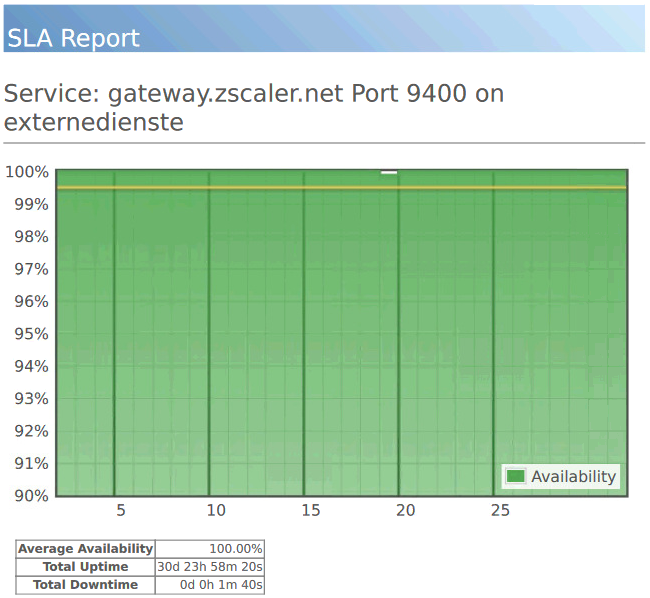
Once the new report was created in the form, it shows up in the list of reports (using the URI /thruk/cgi-bin/reports2.cgi) and a click on the refresh icon will generate the first report. A PDF will be created and a graphic showing the last month, divided into the days (can be selected in the create report form) displays the availability of the selected service:
To make things more automated, these SLA reports can also be created automatically (by a cronjob for example) on the command line using the thruk command:
# Create SLA report using Thruk
# /usr/bin/thruk report $reportid > /tmp/${yearlastmonth}${monthlastmonth}-${url}-thruk.pdf
$reportid refers to the unique report ID (which can be seen in the report list in Thruk's interface)
$yearlastmonth and $monthlastmonth are variables holding the values created by using dateutils.dadd (see article Bash: date -d '1 month ago' still shows the same month for more information).
This command will create the PDF containing the availability number. Unfortunately there seems to be no way to create a text report instead of a PDF. Which makes the automatic parsing a bit more complicated. But with additional tools (pdf2txt), even the PDF's text can be read and the value (Average Availability) parsed:
# Convert pdf to text
/usr/bin/pdftotext /tmp/${yearlastmonth}${monthlastmonth}-${url}-thruk.pdf /tmp/${yearlastmonth}${monthlastmonth}-${url}-thruk.txt
# Export "Average Availability" value from the created pdf
availpercent=$(grep "Average.*Availability" -A 1 /tmp/${yearlastmonth}${monthlastmonth}-${url}-thruk.txt)
# Sometimes the average availability value is on the same line, sometimes a line below
availability=$(echo "$availpercent" | sed -n "/%/p" | head -n 1 | sed "s/[a-z]//gI" | sed "s/\s//g" | tr -d "%")
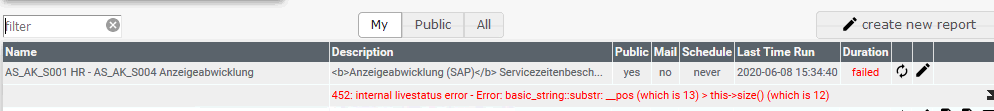
Since this month, probably since Icinga 2 was upgraded from 2.11 to 2.12, reports could not be created in Thruk anymore. Eventually after running for around 3 minutes, an error would be shown in the UI:
452: internal livestatus error - Error: basic_string::substr: __pos (which is 13) > this->size() (which is 12)
Executing the command thruk report manually, resulted in errors pointing to issues inside Icinga 2's livestatus implementation:
[Mon Jun 15 17:42:28 2020][ERROR] undef error - 452: internal livestatus error - Error: basic_string::substr: __pos (which is 13) > this->size() (which is 12)
[Mon Jun 15 17:42:28 2020][ERROR]
[Mon Jun 15 17:42:28 2020][ERROR]
[Mon Jun 15 17:42:28 2020][ERROR] (0) /usr/lib/x86_64-linux-gnu/icinga2/sbin/icinga2() [0x62602b]
[Mon Jun 15 17:42:28 2020][ERROR] (1) icinga2: icinga::LivestatusLogUtility::GetAttributes(icinga::String const&) (+0x209) [0x8f47e9]
[Mon Jun 15 17:42:28 2020][ERROR] (2) icinga2: icinga::LivestatusLogUtility::CreateLogCache(std::map
[Mon Jun 15 17:42:28 2020][ERROR] (3) icinga2: icinga::LogTable::FetchRows(std::function
[Mon Jun 15 17:42:28 2020][ERROR] (4) icinga2: icinga::Table::FilterRows(boost::intrusive_ptr
[Mon Jun 15 17:42:28 2020][ERROR] (5) icinga2: icinga::LivestatusQuery::ExecuteGetHelper(boost::intrusive_ptr
[Mon Jun 15 17:42:28 2020][ERROR] (6) icinga2: icinga::LivestatusQuery::Execute(boost::intrusive_ptr
[Mon Jun 15 17:42:28 2020][ERROR] (7) icinga2: icinga::LivestatusListener::ClientHandler(boost::intrusive_ptr
[Mon Jun 15 17:42:28 2020][ERROR] (8) /usr/lib/x86_64-linux-gnu/icinga2/sbin/icinga2() [0x679f1d]
[Mon Jun 15 17:42:28 2020][ERROR] (9) icinga2: boost::asio::detail::executor_op
[Mon Jun 15 17:42:28 2020][ERROR] (10) /usr/lib/x86_64-linux-gnu/icinga2/sbin/icinga2() [0xab8846]
[Mon Jun 15 17:42:28 2020][ERROR] (11) /usr/lib/x86_64-linux-gnu/icinga2/sbin/icinga2() [0xa12845]
[Mon Jun 15 17:42:28 2020][ERROR] (12) icinga2: boost_asio_detail_posix_thread_function (+0xf) [0x5bb54f]
[Mon Jun 15 17:42:28 2020][ERROR] (13) libpthread.so.0:
[Mon Jun 15 17:42:28 2020][ERROR] (14) libc.so.6: clone (+0x6d) [0x7efed69da41d] at /usr/share/thruk/lib/Thruk/Backend/Manager.pm line 1586.
[Mon Jun 15 17:42:28 2020][ERROR] on reports/sla_service.tt at /usr/share/thruk/lib/Thruk/Views/ToolkitRenderer.pm line 76.
In general, creating the logs directly through the Livestatus backend takes a very long time - even when the reports still worked. Every report took at least 2 minutes to retrieve all the necessary values from Livestatus and create the PDF.
But Thruk has a solution for this: An internal log cache database!
To circumvent the Icinga 2 Livestatus problem (there's not only the slowness talking to but also a non-upstream implementation of Livestatus in Icinga 2 core), Thruk added a "logcache" function. This logcache was created to talk to Icinga 2's IDO (= database) and retrieve the object statistics from it.
Before doing any configuration changes inside /etc/thruk, one must know that Thruk must know to which "IDO instance" it must connect to. This can be verified by connecting to the IDO and running the following query:
MariaDB [icinga]> select * from icinga_instances;
+-------------+---------------+----------------------+
| instance_id | instance_name | instance_description |
+-------------+---------------+----------------------+
| 4 | default | |
+-------------+---------------+----------------------+
1 row in set (0.00 sec)
This means: Thruk must be made aware, that INSTANCE_ID=4.
As Sven Nierlein, creator and maintainer of Thruk, nicely describes this instance id:
INSTANCE_ID is something the IDO sets somehow. It is used to put multiple instances in the same database. Thruk assumes an INSTANCE_ID of 1 but it can be changed by setting the env variable to something else.
To prepare Thruk for logcache, the relevant database privileges must be created:
To enable logcache, the following two lines need to be added into /etc/thruk/thruk_local.conf:
# Using logcache database and fetching logs from IDO
logcache = mysql://thruk:secret@dbhost:3306/thruk_logs
logcache_fetchlogs_command = INSTANCE_ID=4 IDO_DB_HOST=dbhost IDO_DB_PORT=3306 IDO_DB_USER=thruk IDO_DB_PW=secret IDO_DB_NAME=icinga /usr/share/thruk/support/icinga2_ido_fetchlogs.sh mysql
Note: INSTANCE_ID=n needs to be defined if the instance id in IDO is not 1.
The logcache import can be started using thruk logcache command:
root@thruk:~# /usr/bin/thruk -a logcache import --local --start=12w
mysql: [Warning] Using a password on the command line interface can be insecure.
..........................it is recommended to run logcacheoptimize after importing logfiles.
mysql: [Warning] Using a password on the command line interface can be insecure.
.........................it is recommended to run logcacheoptimize after importing logfiles.
mysql: [Warning] Using a password on the command line interface can be insecure.
.........................it is recommended to run logcacheoptimize after importing logfiles.
mysql: [Warning] Using a password on the command line interface can be insecure.
.......................it is recommended to run logcacheoptimize after importing logfiles.
[...]
OK - imported 2017013 log items from 1 site successfully in 1125.53s (1792/s)
This command reads logs from Icinga's IDO database (DB: icinga) and writes them into the log cache database (DB: thruk_logs) on the same DB server. In the command an additional parameter --start=12w was appended. This tells the log import command to only import the last 12 weeks.
Once the logs were imported, the reports could be created again - and this time much faster!
root@thruk:~# time /usr/bin/thruk report 14 > /tmp/14.pdf
[18:02:50,619][ERROR] Can't locate Thruk/Utils/Reports/CustomRender.pm: ./Thruk/Utils/Reports/CustomRender.pm: Permission denied at /etc/thruk/plugins//plugins-enabled/reports2/lib/Thruk/Utils/Reports.pm line 1586.
[Mon Jun 15 18:02:53 2020][ERROR] Can't locate Thruk/Utils/Reports/CustomRender.pm: ./Thruk/Utils/Reports/CustomRender.pm: Permission denied at /etc/thruk/plugins//plugins-enabled/reports2/lib/Thruk/Utils/Reports.pm line 1586.
real 0m3.715s
user 0m0.540s
sys 0m0.100s
root@thruk:~# ll /tmp/14.pdf
-rw-r--r-- 1 root root 65313 Jun 15 18:02 /tmp/14.pdf
SLA Reporting and Availability Statistics are an important asset to the whole monitoring environment! Although there's active work in progress to implement SLA reporting in Icingaweb, currently the best and most efficient way to create statistics and reports of objects monitored by Icinga 2, is by using Thruk in combination with a logcache database. It is up to the developers and the community around Icingaweb to improve the reporting module. On the other hand having Thruk as a central interface for all kinds of Nagios-based monitoring core applications and Icinga 2, allows to create the same kind of statistics from multiple monitoring sources.
No comments yet.

AI AWS Android Ansible Apache Apple Atlassian BSD Backup Bash Bluecoat CMS Chef Cloud Coding Consul Containers CouchDB DB DNS Databases Docker ELK Elasticsearch Filebeat FreeBSD Galera Git GlusterFS Grafana Graphics HAProxy HTML Hacks Hardware Icinga Influx Internet Java KVM Kibana Kodi Kubernetes LVM LXC Linux Logstash Mac Macintosh Mail MariaDB Minio MongoDB Monitoring Multimedia MySQL NFS Nagios Network Nginx OSSEC OTRS Observability Office OpenSearch PHP Perl Personal PostgreSQL PowerDNS Proxmox Proxy Python Rancher Rant Redis Roundcube SSL Samba Seafile Security Shell SmartOS Solaris Surveillance Systemd TLS Tomcat Ubuntu Unix VMware Varnish Virtualization Windows Wireless Wordpress Wyse ZFS Znuny Zoneminder