
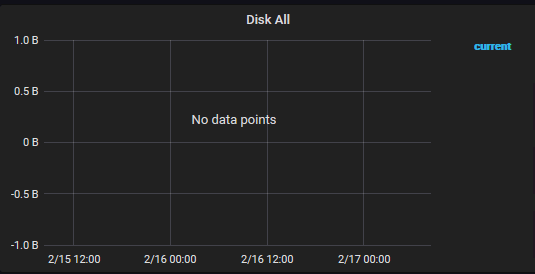
Today I was stumbling across a very interesting problem: CentOS 7 machines would not show any disk usage graphs in our Grafana dashboard (which uses InfluxDB as data source and Icinga 2 as monitoring system).
Let's activate troubleshooting mode!
The first thought was that this particular server may have a problem reporting back performance data. Could it be a buggy NRPE configuration? Or maybe even a bug in check_disk on this particular server?
But by looking at other CentOS 7 machines in Icingaweb 2, another discovery was made: Actually every CentOS 7 machine did not have any disk graphs!
Looking closer in Icingaweb, the value of the disk usage seems to be 0. On every partition. On every CentOS 7 server.
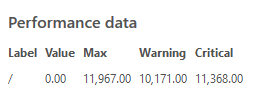
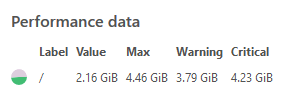
When looking at an Ubuntu Linux server, the values clearly show up:
Where does this 0.00 value on the CentOS machines come from? Is it the plugin check_disk itself? Or is NRPE the reason the data is not correctly landing in Icinga?
By executing the nagios-plugin check_disk on the server, did not seem to trigger any errors. Certainly no 0.00 values, neither in the output nor in the performance data:
[nagios@centos7 ~]# /usr/lib/nagios/plugins/check_disk -w 15% -c 5% -W 10% -K 5% -p /
DISK OK - free space: / 8640 MiB (76.21% inode=95%);| /=2696MiB;10171;11368;0;11967
Even by executing this exact check command through NRPE seemed to work:
root@icinga:~# /usr/lib/nagios/plugins/check_nrpe -H nzz-wwapp01-d.nzzmg.local -c check_disk -a "15%" "5%" "/" "15%" "5%"
DISK OK - free space: / 8640 MiB (76.21% inode=95%);| /=2696MiB;10171;11368;0;11967
So both ways to execute the plugin (locally and via NRPE) seem to work. Maybe Icinga has a problem parsing the performance data?
A look into the Icinga logs quickly turned up a WARNING entry:
[2021-02-17 06:27:56 +0100] warning/InfluxdbWriter: Ignoring invalid perfdata for checkable 'centos7!Diskspace /' and command 'nrpe' with value: /=2696MiB;10171;11368;0;11967
Context:
(0) Processing check result for 'centos7!Diskspace /'
So obviously Icinga somehow thinks that the received performance data is invalid and refuses to write the values into InfluxDB. But why?
Note: At this point I still didn't see the issue. Even for my trained monitoring eye using 15+ years of nagios/monitoring-plugins. ;-)
A research on the Internet led to a discussion in the Icinga forums and from there to the actual source of the problem: A bug in nagios-plugins!
Issue #518 in the nagios-plugins repositories describes a regression bug introduced by nagios-plugins 2.3.0. In the release notes of 2.3.0 the following change was applied to check_disk:
2.3.0 2019-12-04
Note: nagios-plugins 2.3.0 introduced a backward-compatibility issue for performance data graphs produced by check_icmp.
Anyone upgrading from an older version of nagios-plugins should upgrade directly to >=2.3.1.
ENHANCEMENTS
Added a plugin "remove_perfdata" to remove perfdata from another plugin's output
Added a plugin "check_ssl_validity" which verifies a certificate through CRL or OCSP
Added directory plugins-python containing three Python plugins
check_apt: Add --only-critical switch
check_apt: Add --packages-warning (Marc Sánchez)
check_disk: Add --combined-thresholds to alert on a percentage AND raw units.
check_disk: Add --inode-perfdata to get extra performance data from inode statistics
check_disk: Add support for base-10 units kB, MB, GB, TB; rename base-2 units to KiB, MiB, GiB, TiB
[...]
This change caused the performance output units to show MiB instead of MB. However "MiB" is not a valid UOM (Unit of measurement), even described in the Nagios plugin developer guidelines:
UOM (unit of measurement) is a string of zero or more characters, NOT including numbers, semicolons, or quotes. Some examples:
no unit specified - assume a number (int or float) of things (eg, users, processes, load averages)
s - seconds (also us, ms)
% - percentage
B - bytes (also KB, MB, TB)
c - a continous counter (such as bytes transmitted on an interface)
The regression was fixed 3 months later in nagios-plugins 2.3.2:
2.3.2 2020-02-20
FIXES
build: Fix broken builds on some systems, including Homebrew (#508)
check_disk: Change unit calculations to always use binary units for backward compatibility (#518)
[...]
Even though the bug was fixed in the upstream project "nagios-plugins" in 2.3.2, the bug is still around in the current nagios-plugins-disk package, installed from the EPEL 7 repositories. Interesting however is the fact that the package version is showing up as 2.3.3:
[root@centos7 ~]# yum info nagios-plugins-disk
Loaded plugins: fastestmirror
Loading mirror speeds from cached hostfile
* base: mirror.init7.net
* epel: mirror.init7.net
* extras: mirror.init7.net
* updates: mirror.init7.net
Installed Packages
Name : nagios-plugins-disk
Arch : x86_64
Version : 2.3.3
Release : 2.el7
Size : 86 k
Repo : installed
From repo : epel
Summary : Nagios Plugin - check_disk
URL : https://www.nagios-plugins.org/
License : GPLv2+
Description : Provides check_disk support for Nagios.
A bug report was opened in the Fedora EPEL project: Bugzilla 1929568 mentions these findings documented here in this article. Hopefully this bug will shortly be addressed and a new package in the EPEL repositories released.
However further analysis with the latest available upstream release nagios-plugins-2.3.3 reveals that this regression is still happening, although marked as fixed in the changelog:
# ./check_disk -V
check_disk v2.3.3 (nagios-plugins 2.3.3)
# ./check_disk -w 15% -c 5% -W 10% -K 5% -p /
DISK OK - free space: / 8447 MiB (89.03% inode=95%);| /=1040MiB;8512;9514;0;10015
Therefore it's actually still an upstream bug and issue #518 should be re-opened again.
Fortunately an immediate workaround is available: By using the -m parameter, the values will be shown in MegaBytes:
[root@centos7 ~]# /usr/lib/nagios/plugins/check_disk -w 15% -c 5% -W 10% -K 5% -p / -m
DISK OK - free space: / 8640 MB (76.21% inode=95%);| /=2696MB;10171;11368;0;1196
This corrects the UOM in the performance data and data can be parsed and written into InfluxDB again.
For NRPE setups, the check command needs to be adjusted accordingly:
[root@centos7 ~]# grep disk /etc/nagios/nrpe_local.cfg
command[check_disk]=/usr/lib/nagios/plugins/check_disk -w $ARG1$ -c $ARG2$ -W $ARG4$ -K $ARG5$ -p $ARG3$ -m
A couple of years ago, the nagios-plugins project split into two projects: nagios-plugins and monitoring-plugins. Some distributions switched their package sources to monitoring-plugins (Debian and Ubuntu for example) but others remained at the "original" nagios-plugins (such as CentOS). The regression bug which caused the change in the UOM was only introduced in nagios-plugins, not in monitoring-plugins. However in EPEL, there are no monitoring-plugins packages available for installation.
No comments yet.

AI AWS Android Ansible Apache Apple Atlassian BSD Backup Bash Bluecoat CMS Chef Cloud Coding Consul Containers CouchDB DB DNS Databases Docker ELK Elasticsearch Filebeat FreeBSD Galera Git GlusterFS Grafana Graphics HAProxy HTML Hacks Hardware Icinga Influx Internet Java KVM Kibana Kodi Kubernetes LVM LXC Linux Logstash Mac Macintosh Mail MariaDB Minio MongoDB Monitoring Multimedia MySQL NFS Nagios Network Nginx OSSEC OTRS Observability Office OpenSearch PHP Perl Personal PostgreSQL PowerDNS Proxmox Proxy Python Rancher Rant Redis Roundcube SSL Samba Seafile Security Shell SmartOS Solaris Surveillance Systemd TLS Tomcat Ubuntu Unix VMware Varnish Virtualization Windows Wireless Wordpress Wyse ZFS Znuny Zoneminder