
A new version of check_rancher2, an open-source monitoring plugin to monitor Rancher 2 managed Kubernetes clusters, is available!
Release 1.6.0 adds performance data on a single cluster check. You can spot them in the plugin output:
$ ./check_rancher2.sh -H rancher2-test.nzz-tech.ch -U token-xxxxx -P "secret" -S -t cluster -c c-5f6hk
CHECK_RANCHER2 OK - Cluster mycluster is healthy|'cluster_healthy'=1;;;; 'component_errors'=0;;;; 'cpu'=8231;;;;16000 'memory'=11120148480B;;;;33456439296 'pods'=88;;;;440
Or you can also spot them in your favorite monitoring software. Here in Icingaweb2:
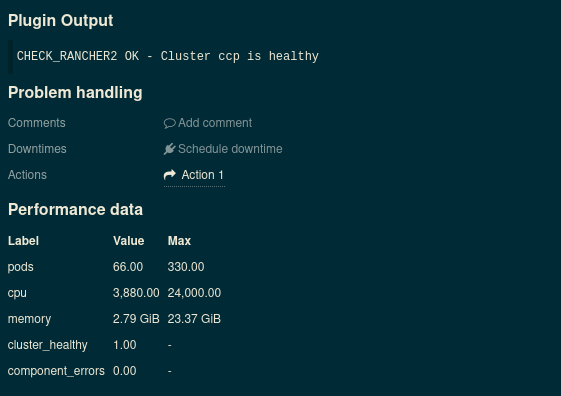
As of this version, performance data includes:
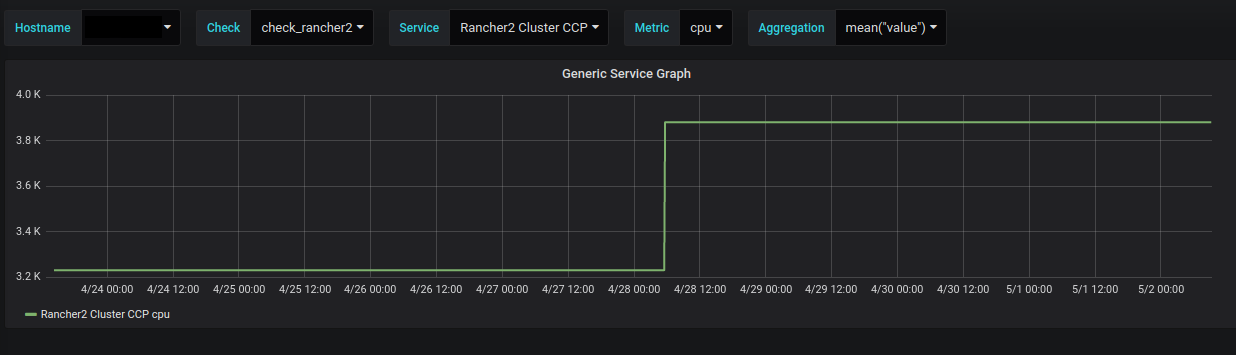
Using performance data allows to create graphs. In this example the CPU usage (in millicores):
Besides the added performance data, version 1.6.0 also contains a bug fix of the "project" check type. In the past versions, a wrong variable was used for status comparison.
These changes were contributed by Steffen Eichler in PR 20. Thanks so much for the open source contribution!
No comments yet.

AI AWS Android Ansible Apache Apple Atlassian BSD Backup Bash Bluecoat CMS Chef Cloud Coding Consul Containers CouchDB DB DNS Databases Docker ELK Elasticsearch Filebeat FreeBSD Galera Git GlusterFS Grafana Graphics HAProxy HTML Hacks Hardware Icinga Influx Internet Java KVM Kibana Kodi Kubernetes LVM LXC Linux Logstash Mac Macintosh Mail MariaDB Minio MongoDB Monitoring Multimedia MySQL NFS Nagios Network Nginx OSSEC OTRS Observability Office OpenSearch PHP Perl Personal PostgreSQL PowerDNS Proxmox Proxy Python Rancher Rant Redis Roundcube SSL Samba Seafile Security Shell SmartOS Solaris Surveillance Systemd TLS Tomcat Ubuntu Unix VMware Varnish Virtualization Windows Wireless Wordpress Wyse ZFS Znuny Zoneminder