
On a large monitoring installation I ran into a problem that a Grafana dashboard continuously showed two entries of the same host:
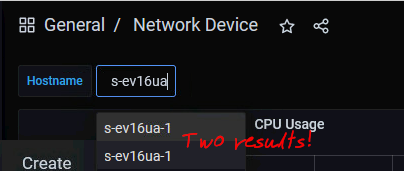
Even though both results look the same, there's a small difference which can't be seen in Grafana.
To find out more, we need to check the Influx query behind this field "Hostname". In the dashboard settings this can be found under Variables.
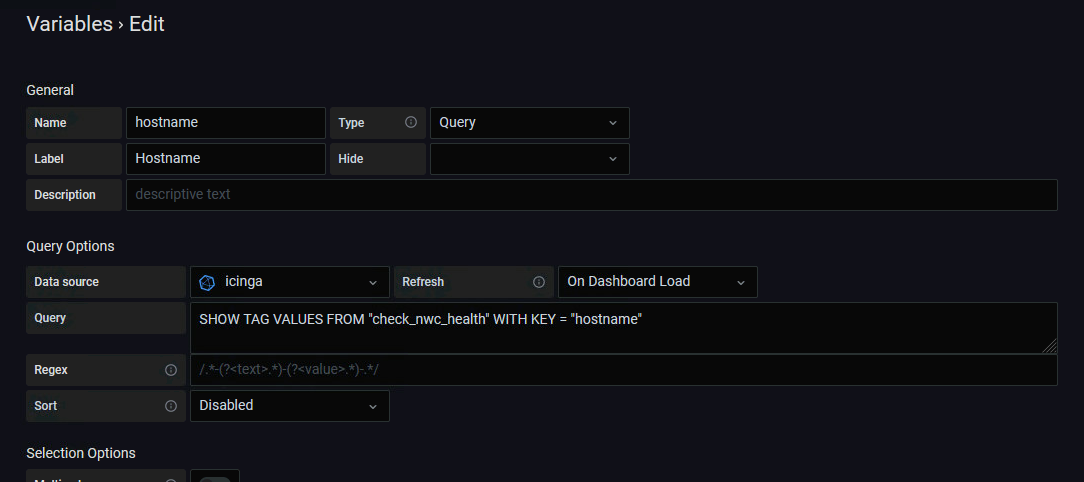
This shows us, that behind this "hostname" field, there's a Query on the Data source - which is an InfluxDB - showing the TAG VALUES of the measurement "check_nwc_health".
With the information obtained in Grafana, the same query can now be executed manually on the InfluxDB:
> SHOW TAG VALUES FROM check_nwc_health WITH KEY="hostname"
name: check_nwc_health
key value
--- -----
hostname s-ev16ua-1
hostname DZD-CORE101
hostname DZD-SRV101
hostname LU-LEAF-3
hostname LU-LEAF-4
[...]
The very first entry is intriguing. It's our problematic result showing up twice in Grafana! And it seems that it actually starts with a white-space or another character not properly shown in the result.
For some reason data was entered into InfluxDB with an error in the hostname and this now messes up the results. We need to filter the results for valid hostnames only.
Note: The reason is actually the responsible network administrator entered a typo when this network device was added to the monitoring config. As this was fixed in Icinga itself, the data with the typo was still hanging around.
The first idea was to get a list of the TAG VALUES but only with recent entries (from the last 4 hours):
> SHOW TAG VALUES FROM check_nwc_health WITH KEY="hostname" WHERE time > NOW() - 4h
name: check_nwc_health
key value
--- -----
hostname s-ev16ua-1
hostname DZD-CORE101
hostname DZD-SRV101
hostname LU-LEAF-3
hostname LU-LEAF-4
[...]
Although the query seemed to work (there was no error), it didn't have any effect on the result. The reason is that time or time range filtering only works with FIELDS (such as value) but not with TAGS (such as hostname).
So we need another approach.
The next try was to use SELECT to get a list of the hostnames. But - surprise, surprise - nothing showed up in the result:
> SELECT "hostname" FROM check_nwc_health
>
The reason for this can be found in the documentation:
SELECT "<field_key>","<tag_key>" - Returns a specific field and tag. The SELECT clause must specify at least one field when it includes a tag.
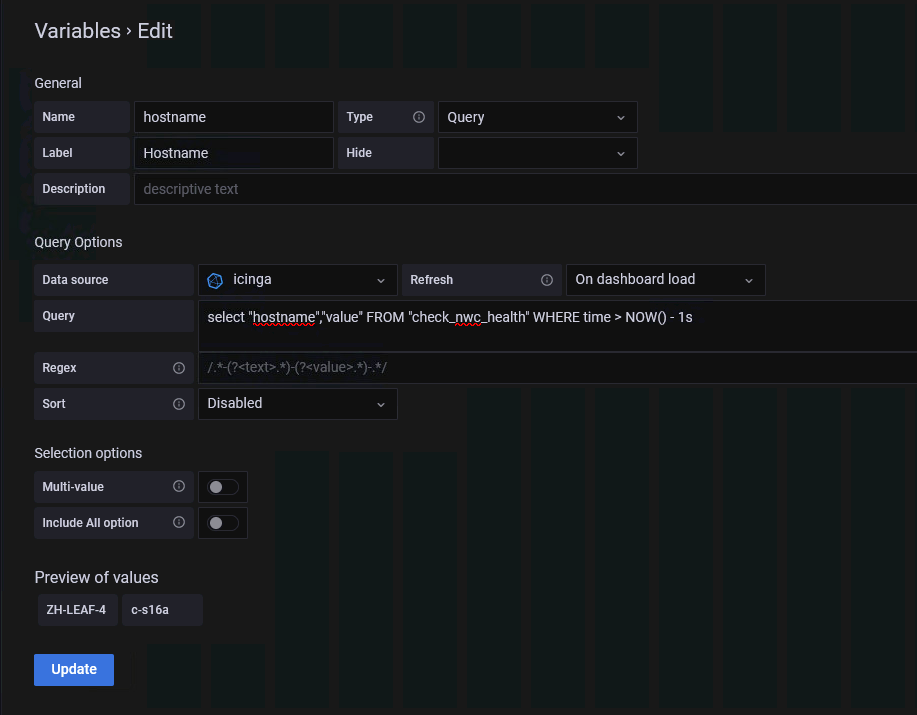
This means we need to add at least one FIELD to the query. To limit the result I added the time range within the last 10 seconds:
> SELECT "hostname","value" FROM check_nwc_health WHERE time > NOW() - 10s
name: check_nwc_health
time hostname value
---- -------- -----
1676971724000000000 LU-LEAF-4 0.05
1676971724000000000 LU-LEAF-4 0.43
1676971724000000000 LU-LEAF-4 0
1676971724000000000 LU-LEAF-4 0
1676971724000000000 LU-LEAF-4 0
[...]
It turns out that this works as the valid hostnames (without the values) show up in Grafana:
Although this works technically, the SELECT query (with the final 4 hour range) takes much longer than using the SHOW TAG VALUES query:
root@influx:~# time echo 'SELECT "hostname","value" FROM check_nwc_health WHERE time > NOW() - 4h' | influx -username user -password secret -database icinga > /dev/null
real 0m25.577s
user 0m12.929s
sys 0m4.932s
root@influx:~# time echo 'SHOW TAG VALUES FROM check_nwc_health WITH KEY=hostname' | influx -username user -password secret -database icinga > /dev/null
real 0m0.053s
user 0m0.028s
sys 0m0.012s
That's a performance kill for the dashboard and a no-go.
Back to step 2 then. We know that the problematic result begins with a white-space (or another unidentifiable character). Luckily SHOW TAG VALUES supports a WHERE condition (just not using time based conditions). With that knowledge we can now add a condition that the actual tag value must begin with a letter:
> SHOW TAG VALUES FROM check_nwc_health WITH KEY="hostname" WHERE hostname =~ /^[a-z]/
name: check_nwc_health
key value
--- -----
hostname aar-g1-sw-01
hostname aar-g2-sw-03
hostname aar-g2-sw-04
[...]
Great, the problem hostname is gone and does not show up in the results anymore. But so do hostnames which were entered with capital letters. Luckily I already know how to handle case-insensitive matching in InfluxDB:
> SHOW TAG VALUES FROM check_nwc_health WITH KEY="hostname" WHERE hostname =~ /^(?i)[a-z]/
name: check_nwc_health
key value
--- -----
hostname DZD-CORE101
hostname DZD-SRV101
hostname LU-LEAF-3
hostname LU-LEAF-4
[...]
The result now represents all the known hostnames, excluding the troublemaker " s-ev16ua-1".
The last thing to do is to adjust the variable in Grafana with the updated query:
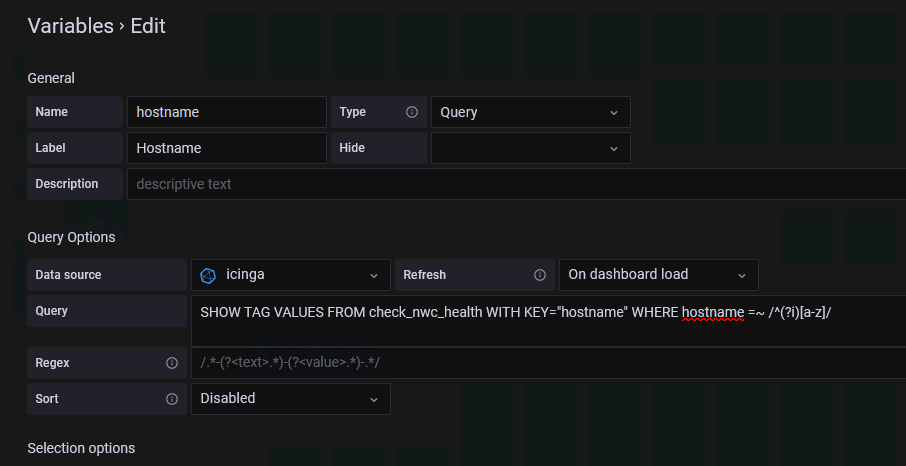
With this query, Grafana now only shows the correctly entered hostnames in the "Hostname" field for selection. And most importantly no performance hit can be felt while using the dashboard.
No comments yet.

AI AWS Android Ansible Apache Apple Atlassian BSD Backup Bash Bluecoat CMS Chef Cloud Coding Consul Containers CouchDB DB DNS Databases Docker ELK Elasticsearch Filebeat FreeBSD Galera Git GlusterFS Grafana Graphics HAProxy HTML Hacks Hardware Icinga Influx Internet Java KVM Kibana Kodi Kubernetes LVM LXC Linux Logstash Mac Macintosh Mail MariaDB Minio MongoDB Monitoring Multimedia MySQL NFS Nagios Network Nginx OSSEC OTRS Observability Office OpenSearch PHP Perl Personal PostgreSQL PowerDNS Proxmox Proxy Python Rancher Rant Redis Roundcube SSL Samba Seafile Security Shell SmartOS Solaris Surveillance Systemd TLS Tomcat Ubuntu Unix VMware Varnish Virtualization Windows Wireless Wordpress Wyse ZFS Znuny Zoneminder