
A couple of weeks ago our primary and central backup server started suffering from very bad performance. It all started with a hint, that the nightly backup jobs ran longer than usual. But with each day, the backup duration (which is also monitored and graphed in our central monitoring) increased. What was going on?
During our initial analysis it didn't take long and we spotted increasing IOWAIT numbers. We get these numbers from the monitoring plugin check_cpu_stats and each check result is stored in a time series database (InfluxDB) to create and see historic performance graphs.
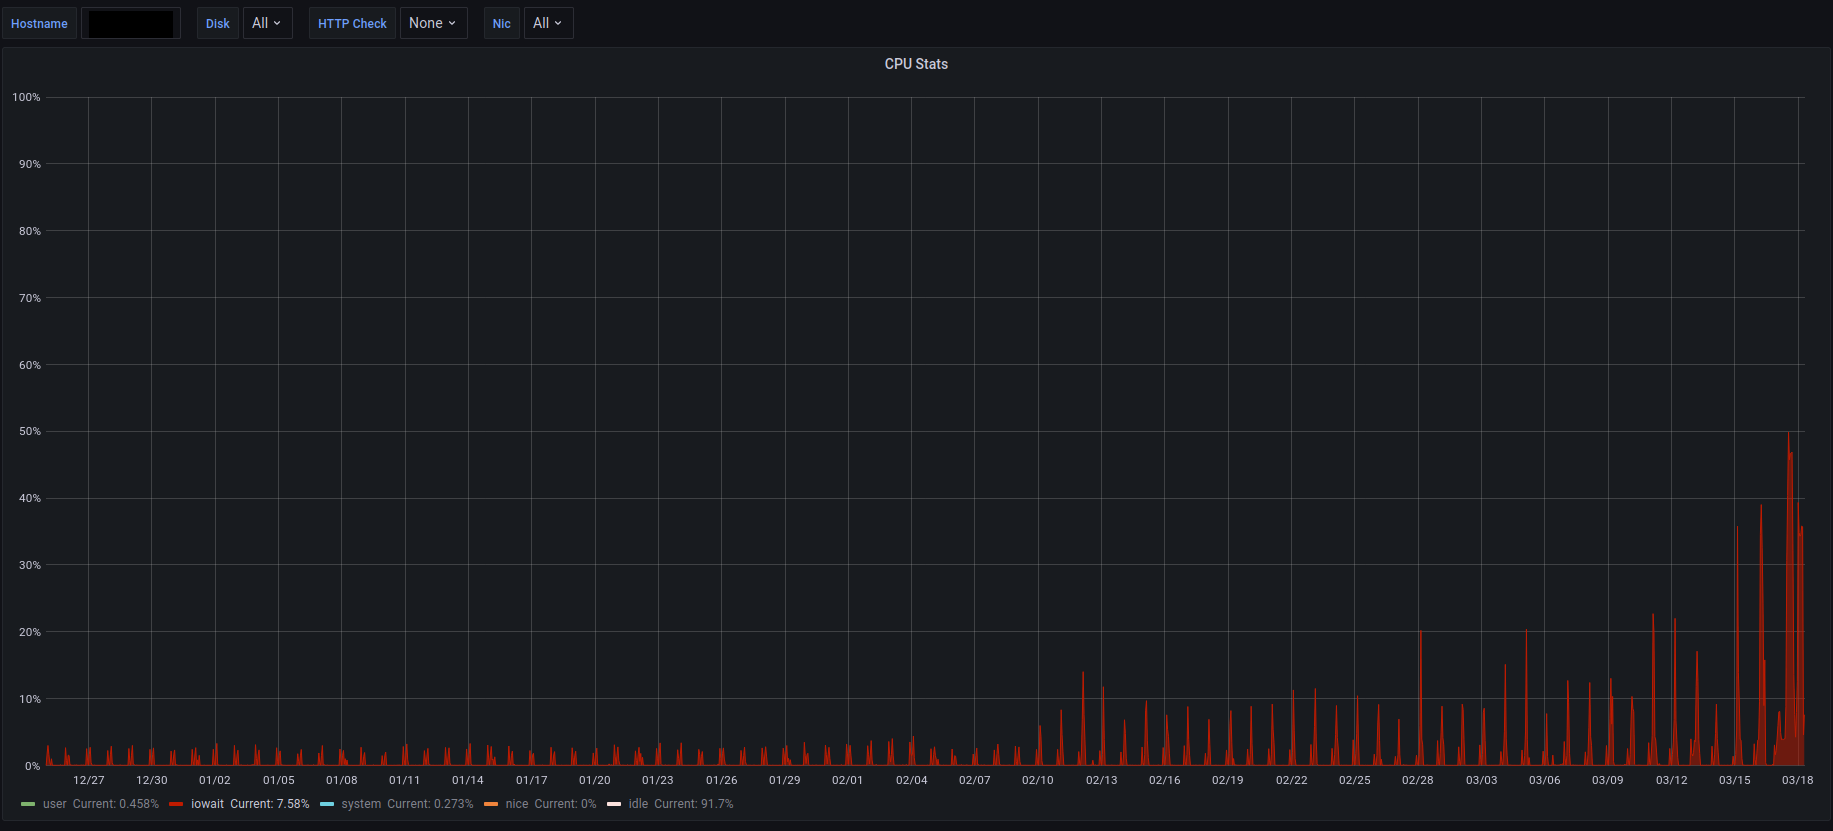
Prior to February 10th the IOWAIT numbers were significantly low, only showing up during the nightly backup jobs - which was expected. But on that day (February 10th), according to the graph, the average IOWAIT increased and continued to either remain on a higher average or increase even further. By the end of the graph in mid march, the performance was so bad, the nightly backups would've taken longer than 24 hours to complete (usually they complete within 2 hours). Not only backup suffered from the increasing IOWAIT, at certain moments even SSHing into the server would run into timeouts.
Of course we thought of a couple of possible reasons which could have explained increasing IOWAIT and a performance impact on this backup server. Each potential reason was followed up upon to find the reason for this problem.
Besides the logical drives used for backups, the same physical RAID controller was also used for the OS drive, running on a different Logical Drive on separate physical solid state drives. After temporary disabling the backup drives, no performance issue could be seen. Drive write tests showed no unexpected IOWAIT. We could therefore rule out a problem on the RAID controller.
Backup servers often use ZFS, mostly for the de-duplication feature. ZFS can run into very bad performance when the file system has not enough memory available for the ZFS Cache. In this situation IOWAIT and disk write time increase. But as we are using ext4 formatted file systems on the server, this could be ruled out. We performed EXT4 file system checks (which seemed to take forever but turned out OK) and also verified the Kernel has enough free memory for file system caching (which it did). We could therefore rule out a file system problem.
This was one of the first guesses. Maybe one (or multiple) drives of that RAID array is having a serious problem? But as we are using hard drive monitoring using the check_smart monitoring plugin, we get alerted immediately when bad sectors or other defects are detected. None of the drives in that backup raid array showed any signs of bad sectors, re-allocated sectors or even sectors with pending reallocation.
Another potential reason for bad server performance are network mounts which have become "stale". Sometimes due to timeouts, sometimes because the file server (from which the share is mounted) disappeared or has stopped. This can often be seen on servers mounting a NFS share and the NFS server times out. But as this backup server did not use any mounted network shares, we could quickly rule this one out, too.
After almost 20 years working with Unix and Linux systems you see and solve a lot of errors and problems, sometimes deemed impossible. We've seen situations where backup jobs overwrite each other, causing the prior process to become a non-interruptable process, locking the device and consequently the next backup jobs. But in this situation (we are using rsnapshot as an open source backup strategy), we could rule this out. Rsnapshot itself has a simple but effective lock file, avoiding yet another daily job to execute on top of another. After a manual verification we could rule out a process being responsible for the problem. Even after a reboot and without any additional services or processes started, we could reproduce high IOWAIT on the backup volume. Nope, a process can definitely be ruled out.
Maybe the server got dirty? This sounds kind of stupid, but needs to be followed-up, too. Dust can have some underestimated impact on a physical server. I personally have seen this on my meanwhile very old but still working NAS (a micro server from HP) where I've ran into Kernel errors pointing to dust on the motherboard. But as this backup server runs in a professional and highly secure data center with professional climate controls and fans, the risk of having dust in the air is highly reduced. But a quick look into the server itself also helped to rule this potential reason out, too.
None of the above possibilities turned out to be the reason or could be technically proven. This means we have a problem; we still see the extremely high (and further increasing) IOWAITs yet we still have no real clue what the cause could be!
At this point we needed to boldly go, where no man has gone before: Ditch our previous possible causes and search for the new frontier (or a new kind of trouble maker we haven't seen yet).
Thanks to our monitoring and the IOWAIT performance graph we knew when the problems more or less started (around February 10th). After checking performance graphs of CPU, Memory, Hardware (Fans, Power Usage, etc), Processes, File System Usage and more, we looked at the hard drive's SMART information - again. We already looked at them in detail when we thought that bad or pending sectors could be the cause of the problem but this time we shifted focus to the other available statistics.
After digging through the data, once again collected by check_smart, we finally stumbled across an interesting graph when focusing on the Load_Cycle_Count value:
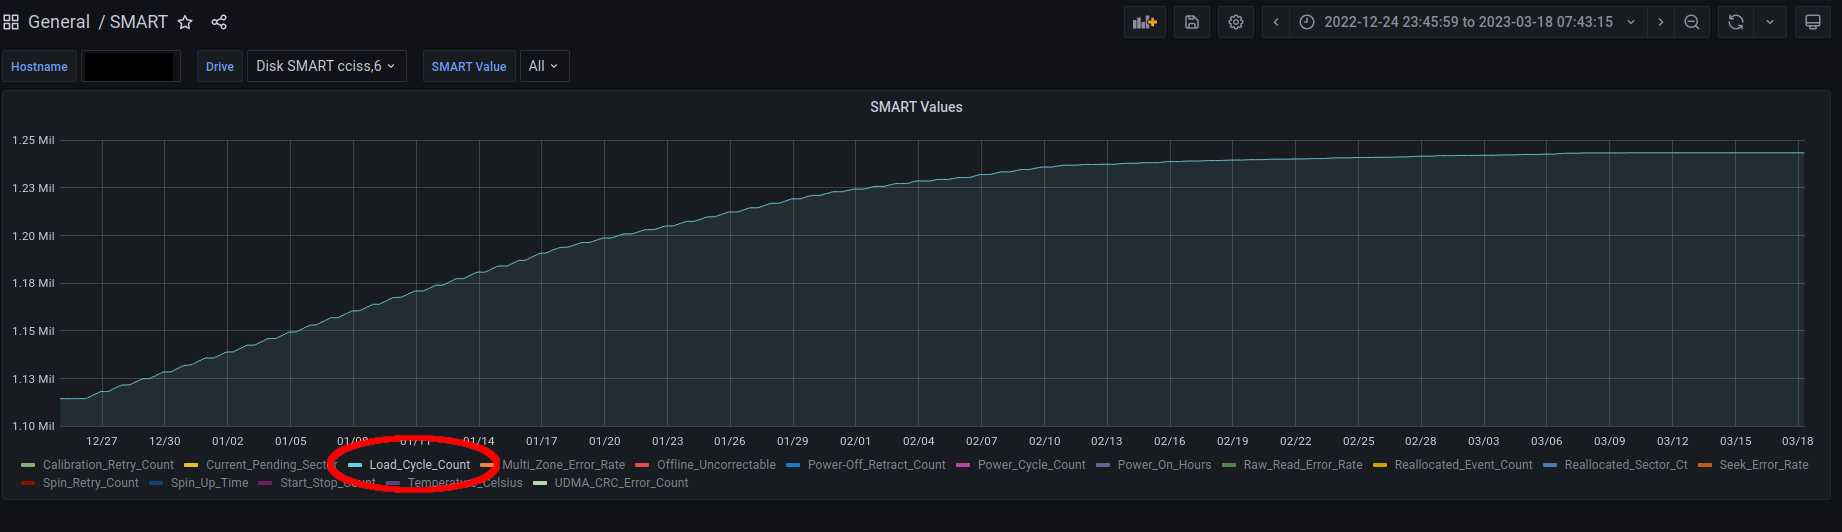
The graph shows a steady increase of the Load_Cycle_Count value - until all of a sudden the value flattens out and does not increase further. Was this a pure coincidence or could this finally be a hint?
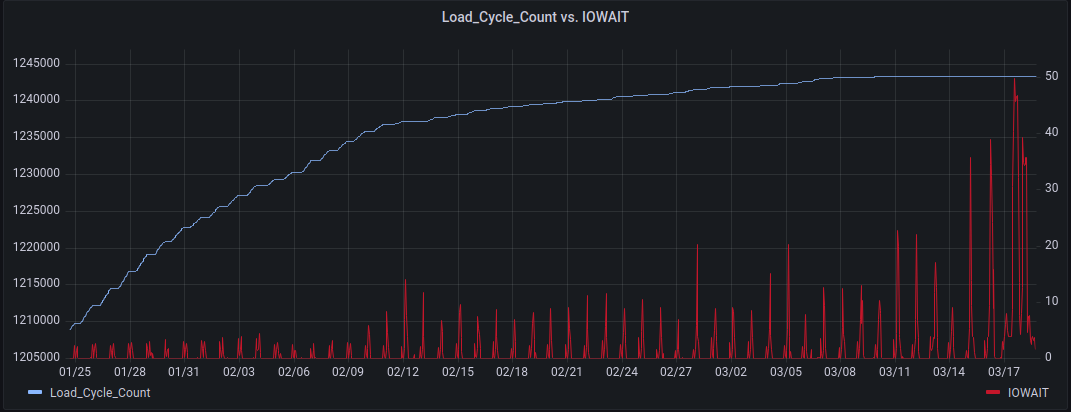
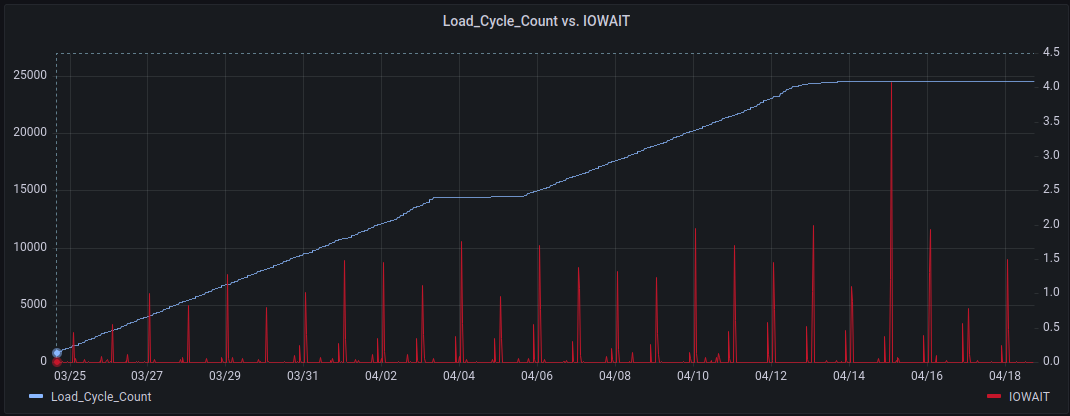
We took both data series (Load_Cycle_Count of one of the drives in the affected RAID array and the server's IOWAIT statistics) and created a new graph in Grafana containing both statistics. To our surprise the resulting graph clearly showed evidence that there must be a correlation:
With that new information at hand, what does the Load_Cycle_Count value actually represent? And this is where this article walks into "undocumented terrain". Although almost all hard drives show this information, not much can be found about this SMART attribute. However when looking at data sheets or technical product specifications of hard drives (across all vendors), almost all hard drives mention a 600'000 value for load/unload cycles. Here's an example from a Western Digital product specification:
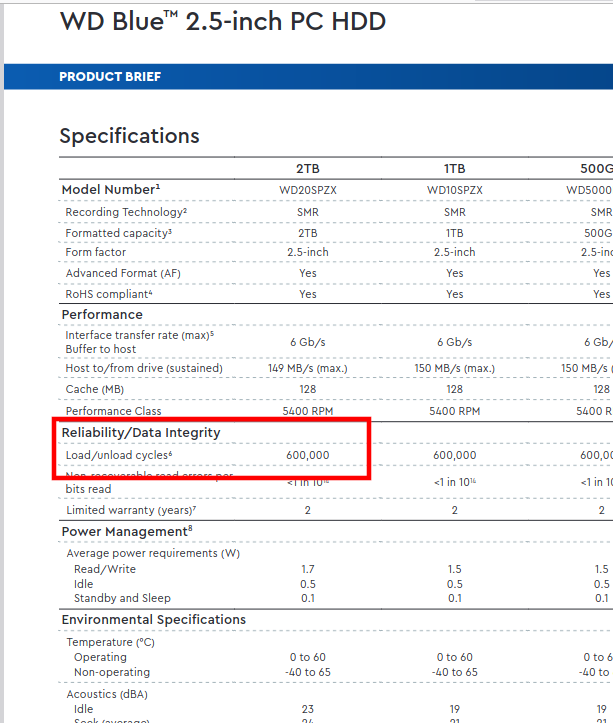
We can also see, that the "Load/unload cycles" value is placed in the Reliability category (similar to TBW for Solid State Drives). The mentioned footnote (6) is not helpful though. Is this a max limit? Is it simply a best practice value? Can it be ignored altogether?
Additional research of this SMART attribute also led us to a question on Super User, which shows a very helpful answer:
Most newer hard drives are good for 600,000 load cycles. In practice, you can usually do more, but the risk of hard drive failure is significantly increased. The reason for this is that continued wear to the head parking mechanism could eventually result in damage to and failure of the read/write heads themselves.
Although there is no official statement from the hard drive vendor's that reaching 600'000 load cycles expires the warranty or will lead to disk degradation, it can be understood as "last safe point". The hard drives *should* operate normally with expected performance up to reaching 600'000 load cycles, but *could* then decrease performance or fail completely. Many disks run into some bad/defect sectors before actually reaching such a high number of load cycles, so this was maybe an exception, too.
Multiple drives in the affected RAID array had reached more than 1.2 Million load cycles (see graph above) and then performance decreased significantly. Interestingly that's exactly the double of the mentioned 600K load cycles.
Initially we intended to replace one drive after another. We tried it on the first drive but RAID resync was so slow, it took 3 hours for only 10%. As all drives in the array were already above 600K load cycles, we decided to scratch this idea and reconstruct the backup RAID array with completely new hard drives. Of course this was done within minutes and on the next backup run in the next night we were back to normal performance.
The load cycles of the new drive(s) grow quickly, too, but IOWAIT is back to a low and expected percentage.
Wow, who would have thought of looking at the Load_Cycle_Count SMART attribute? We didn't. But you eventually have to run into such never-before-seen problems to learn something new.
In the future we will have a closer look at hard drives' number of load cycles and replace them before reaching the 600K "safe" line.
Additionally, we will work on the check_smart monitoring plugin to add an alert (warning) when reaching the 600K load cycles. Again, this doesn't forcibly mean that the drive is failing immediately but it's another important hint that it's time to replace the hard drive.
No comments yet.

AI AWS Android Ansible Apache Apple Atlassian BSD Backup Bash Bluecoat CMS Chef Cloud Coding Consul Containers CouchDB DB DNS Databases Docker ELK Elasticsearch Filebeat FreeBSD Galera Git GlusterFS Grafana Graphics HAProxy HTML Hacks Hardware Icinga Influx Internet Java KVM Kibana Kodi Kubernetes LVM LXC Linux Logstash Mac Macintosh Mail MariaDB Minio MongoDB Monitoring Multimedia MySQL NFS Nagios Network Nginx OSSEC OTRS Observability Office OpenSearch PHP Perl Personal PostgreSQL PowerDNS Proxmox Proxy Python Rancher Rant Redis Roundcube SSL Samba Seafile Security Shell SmartOS Solaris Surveillance Systemd TLS Tomcat Ubuntu Unix VMware Varnish Virtualization Windows Wireless Wordpress Wyse ZFS Znuny Zoneminder