
When using PostgreSQL databases, then you should monitor them! Bucardo's check_postgresl monitoring plugin is perfect for this job and has been around for a long time. In fact, I've been using check_postgresl.pl for many many years.
Note: There are different monitoring plugins with the name "check_postgres". Make sure you use check_postgresl.pl from Bucardo!
One particular check type of the monitoring plugin is the dbstats check (--action dbstats). It allows to collect counters around all or a particular database, including updates, reads, inserts, etc. This gives you (and the DBA) an idea of the database usage:
ck@postgres:~$ /usr/lib/nagios/plugins/check_postgres.pl --action dbstats --dbpass secret -H 127.0.0.1 -u monitoring --include mydb
backends:50 commits:393439724 rollbacks:5075910 read:24492816 hit:186650222299 idxscan:0 idxtupread:0 idxtupfetch:0 idxblksread:0 idxblkshit:0 seqscan:0 seqtupread:0 ret:580249110506 fetch:110237029087 ins:38273885 upd:9854389 del:10144892 dbname:mydb
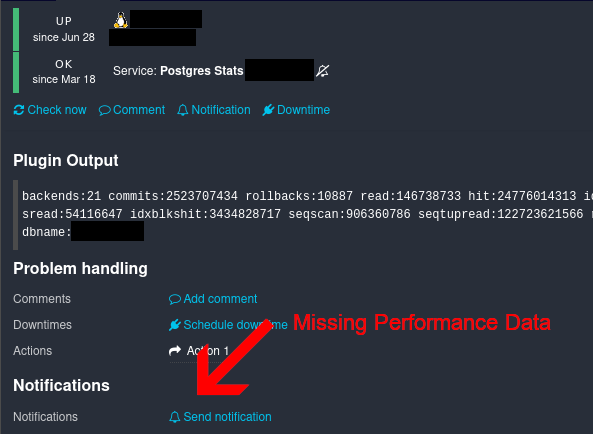
In the command above, statistics for a particular database (--include mydb) are retrieved and presented. Experienced nagios-plugins or monitoring-plugins user quickly see that there are no performance data showing up.
Note for the newbies: Performance data is presented after a pipe (|) character in the output line of a monitoring plugin.
In the past, many years ago, I didn't care as I was using Nagiosgraph to create my data graphs. Nagiosgraph had the option to use either the plugin's output or the performance data as data input.
But nowadays using Icinga2 as monitoring core software and InfluxDB as time series database for performance data this doesn't work anymore. Icinga 2 only writes data into InfluxDB (using the InfluxDBWriter) when performance data is detected. And that's not the case with the dbstats action:
This has been bothering me for years. Let's do something against it; let's fix it.
Working on a monitoring plugin of someone else is always interesting. But it can also be challenging. Not your code, not your ideas. A change shouldn't completely mess up the logic of the author, the previous style and "way of thinking" should be respected. That's not always easy - but should definitely be strongly considered.
In this situation, check_postgres is a Perl script. It's been a while since I last looked at some Perl code (mainly from my own check_smart.pl plugin) so this always takes a bit of time.
Actually the way the dbstats check was originally set up, is kind of weird (for a monitoring plugin). If multiple database statistics are parsed (which is done by the plugin using the pg_stat_database in the background), they are simply shown in the output, one line after another:
ck@postgres:~$ ./check_postgres.pl --action dbstats --dbpass secret -H 127.0.0.1 -u monitoring
backends:0 commits:1154581 rollbacks:644 read:1264 hit:41161088 idxscan:0 idxtupread:0 idxtupfetch:0 idxblksread:0 idxblkshit:0 seqscan:0 seqtupread:0 ret:17578523 fetch:9894232 ins:1882 upd:14 del:1613 dbname:|backends=0;;;; commits=1154581;;;; rollbacks=644;;;; read=1264;;;; hit=41161088;;;; idxscan=0;;;; idxtupread=0;;;; idxtupfetch=0;;;; idxblksread=0;;;; idxblkshit=0;;;; seqscan=0;;;; seqtupread=0;;;; ret=17578523;;;; fetch=9894232;;;; ins=1882;;;; upd=14;;;; del=1613;;;;
backends:1 commits:1193855 rollbacks:17 read:5292 hit:97585516 idxscan:0 idxtupread:0 idxtupfetch:0 idxblksread:0 idxblkshit:0 seqscan:0 seqtupread:0 ret:336177231 fetch:49223869 ins:7 upd:91 del:0 dbname:postgres|backends=1;;;; commits=1193855;;;; rollbacks=17;;;; read=5292;;;; hit=97585516;;;; idxscan=0;;;; idxtupread=0;;;; idxtupfetch=0;;;; idxblksread=0;;;; idxblkshit=0;;;; seqscan=0;;;; seqtupread=0;;;; ret=336177231;;;; fetch=49223869;;;; ins=7;;;; upd=91;;;; del=0;;;;
backends:0 commits:771330 rollbacks:0 read:5283 hit:28417797 idxscan:0 idxtupread:0 idxtupfetch:0 idxblksread:0 idxblkshit:0 seqscan:0 seqtupread:0 ret:337089774 fetch:5519914 ins:17501 upd:855 del:34 dbname:template1|backends=0;;;; commits=771330;;;; rollbacks=0;;;; read=5283;;;; hit=28417797;;;; idxscan=0;;;; idxtupread=0;;;; idxtupfetch=0;;;; idxblksread=0;;;; idxblkshit=0;;;; seqscan=0;;;; seqtupread=0;;;; ret=337089774;;;; fetch=5519914;;;; ins=17501;;;; upd=855;;;; del=34;;;;
backends:0 commits:0 rollbacks:0 read:0 hit:0 idxscan:0 idxtupread:0 idxtupfetch:0 idxblksread:0 idxblkshit:0 seqscan:0 seqtupread:0 ret:0 fetch:0 ins:0 upd:0 del:0 dbname:template0|backends=0;;;; commits=0;;;; rollbacks=0;;;; read=0;;;; hit=0;;;; idxscan=0;;;; idxtupread=0;;;; idxtupfetch=0;;;; idxblksread=0;;;; idxblkshit=0;;;; seqscan=0;;;; seqtupread=0;;;; ret=0;;;; fetch=0;;;; ins=0;;;; upd=0;;;; del=0;;;;
backends:50 commits:393455346 rollbacks:5075910 read:24492847 hit:186655566741 idxscan:0 idxtupread:0 idxtupfetch:0 idxblksread:0 idxblkshit:0 seqscan:0 seqtupread:0 ret:580255008121 fetch:110240978010 ins:38274192 upd:9854660 del:10145221 dbname:mydb|backends=50;;;; commits=393455346;;;; rollbacks=5075910;;;; read=24492847;;;; hit=186655566741;;;; idxscan=0;;;; idxtupread=0;;;; idxtupfetch=0;;;; idxblksread=0;;;; idxblkshit=0;;;; seqscan=0;;;; seqtupread=0;;;; ret=580255008121;;;; fetch=110240978010;;;; ins=38274192;;;; upd=9854660;;;; del=10145221;;;;
Usually a monitoring plugin should return information in a single output line - with a pipe (|) character leading the performance data. And all that in the same line. Strange.
To add performance data and handle this multi-line output, the following changes were done:
The detailed code changes can be seen in the pull request on GitHub.
Running the updated check_postgres now shows a single line output with appended performance data. Here an example with a single database:
ck@postgres:~$ ./check_postgres.pl --action dbstats --dbpass secret -H 127.0.0.1 -u monitoring --include mydb
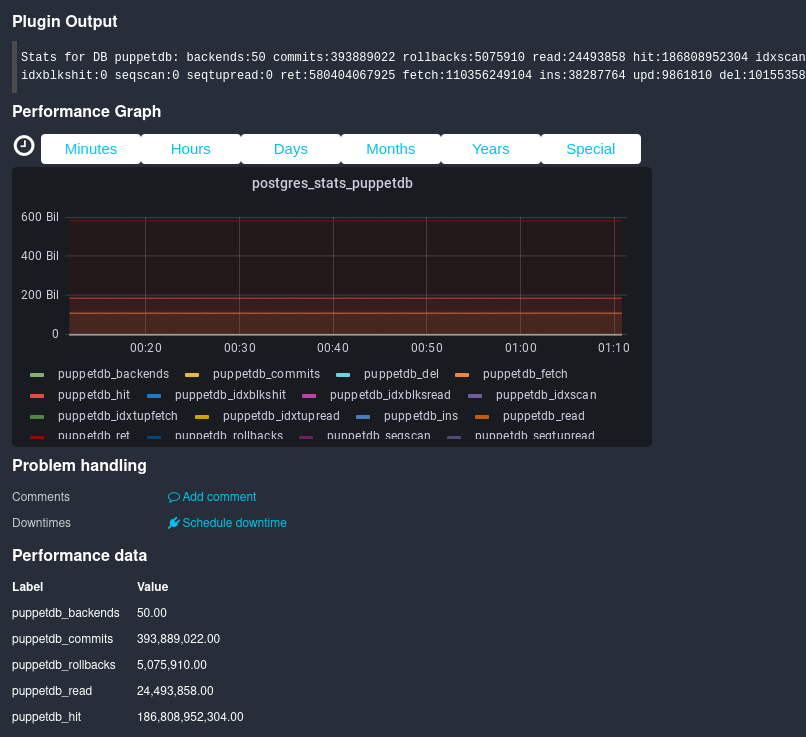
Stats for DB mydb: backends:50 commits:393538013 rollbacks:5075910 read:24493024 hit:186684738036 idxscan:0 idxtupread:0 idxtupfetch:0 idxblksread:0 idxblkshit:0 seqscan:0 seqtupread:0 ret:580282723797 fetch:110262996641 ins:38275898 upd:9855968 del:10146199 --- |mydb_backends=50;;;; mydb_commits=393538013;;;; mydb_rollbacks=5075910;;;; mydb_read=24493024;;;; mydb_hit=186684738036;;;; mydb_idxscan=0;;;; mydb_idxtupread=0;;;; mydb_idxtupfetch=0;;;; mydb_idxblksread=0;;;; mydb_idxblkshit=0;;;; mydb_seqscan=0;;;; mydb_seqtupread=0;;;; mydb_ret=580282723797;;;; mydb_fetch=110262996641;;;; mydb_ins=38275898;;;; mydb_upd=9855968;;;; mydb_del=10146199;;;;
As you can see the performance data elements each contain the name of the database (mydb). This is a must, especially when using multiple databases:
ck@postgres:~$ ./check_postgres.pl --action dbstats --dbpass secret -H 127.0.0.1 -u monitoring Stats for DB postgres: backends:1 commits:1194355 rollbacks:17 read:5292 hit:97661742 idxscan:0 idxtupread:0 idxtupfetch:0 idxblksread:0 idxblkshit:0 seqscan:0 seqtupread:0 ret:336331475 fetch:49270807 ins:7 upd:91 del:0 --- Stats for DB template1: backends:0 commits:771428 rollbacks:0 read:5283 hit:28421374 idxscan:0 idxtupread:0 idxtupfetch:0 idxblksread:0 idxblkshit:0 seqscan:0 seqtupread:0 ret:337132649 fetch:5520600 ins:17501 upd:855 del:34 --- Stats for DB template0: backends:0 commits:0 rollbacks:0 read:0 hit:0 idxscan:0 idxtupread:0 idxtupfetch:0 idxblksread:0 idxblkshit:0 seqscan:0 seqtupread:0 ret:0 fetch:0 ins:0 upd:0 del:0 --- Stats for DB mydb: backends:50 commits:393537778 rollbacks:5075910 read:24493024 hit:186684485479 idxscan:0 idxtupread:0 idxtupfetch:0 idxblksread:0 idxblkshit:0 seqscan:0 seqtupread:0 ret:580282485959 fetch:110262795010 ins:38275879 upd:9855953 del:10146181 --- |postgres_backends=1;;;; postgres_commits=1194355;;;; postgres_rollbacks=17;;;; postgres_read=5292;;;; postgres_hit=97661742;;;; postgres_idxscan=0;;;; postgres_idxtupread=0;;;; postgres_idxtupfetch=0;;;; postgres_idxblksread=0;;;; postgres_idxblkshit=0;;;; postgres_seqscan=0;;;; postgres_seqtupread=0;;;; postgres_ret=336331475;;;; postgres_fetch=49270807;;;; postgres_ins=7;;;; postgres_upd=91;;;; postgres_del=0;;;; template1_backends=0;;;; template1_commits=771428;;;; template1_rollbacks=0;;;; template1_read=5283;;;; template1_hit=28421374;;;; template1_idxscan=0;;;; template1_idxtupread=0;;;; template1_idxtupfetch=0;;;; template1_idxblksread=0;;;; template1_idxblkshit=0;;;; template1_seqscan=0;;;; template1_seqtupread=0;;;; template1_ret=337132649;;;; template1_fetch=5520600;;;; template1_ins=17501;;;; template1_upd=855;;;; template1_del=34;;;; template0_backends=0;;;; template0_commits=0;;;; template0_rollbacks=0;;;; template0_read=0;;;; template0_hit=0;;;; template0_idxscan=0;;;; template0_idxtupread=0;;;; template0_idxtupfetch=0;;;; template0_idxblksread=0;;;; template0_idxblkshit=0;;;; template0_seqscan=0;;;; template0_seqtupread=0;;;; template0_ret=0;;;; template0_fetch=0;;;; template0_ins=0;;;; template0_upd=0;;;; template0_del=0;;;; mydb_backends=50;;;; mydb_commits=393537778;;;; mydb_rollbacks=5075910;;;; mydb_read=24493024;;;; mydb_hit=186684485479;;;; mydb_idxscan=0;;;; mydb_idxtupread=0;;;; mydb_idxtupfetch=0;;;; mydb_idxblksread=0;;;; mydb_idxblkshit=0;;;; mydb_seqscan=0;;;; mydb_seqtupread=0;;;; mydb_ret=580282485959;;;; mydb_fetch=110262795010;;;; mydb_ins=38275879;;;; mydb_upd=9855953;;;; mydb_del=10146181;;;;
Thanks to the plugin changes, Icinga2 now detects the performance data and is able to create graphs:
Enjoy!
No comments yet.

AI AWS Android Ansible Apache Apple Atlassian BSD Backup Bash Bluecoat CMS Chef Cloud Coding Consul Containers CouchDB DB DNS Databases Docker ELK Elasticsearch Filebeat FreeBSD Galera Git GlusterFS Grafana Graphics HAProxy HTML Hacks Hardware Icinga Influx Internet Java KVM Kibana Kodi Kubernetes LVM LXC Linux Logstash Mac Macintosh Mail MariaDB Minio MongoDB Monitoring Multimedia MySQL NFS Nagios Network Nginx OSSEC OTRS Observability Office OpenSearch PHP Perl Personal PostgreSQL PowerDNS Proxmox Proxy Python Rancher Rant Redis Roundcube SSL Samba Seafile Security Shell SmartOS Solaris Surveillance Systemd TLS Tomcat Ubuntu Unix VMware Varnish Virtualization Windows Wireless Wordpress Wyse ZFS Znuny Zoneminder