
A new version of check_smart, a monitoring plugin to monitor physical hard drives, solid state drives and NVMe drives, is now available. Version 6.14.2 contains a bug fix for NVMe drives, when used in combination with the "auto" interface (-i auto).
Big thanks and kudos go to Yannick Martin for detecting and fixing the bug!
Before 6.14.2, the plugin would focus on ATA SMART attributes and ignore NVMe attributes, when the plugin was launcehd with -i auto. This lead to not detecting errors in the "Media and Data Integrity Errors" attribute and the plugin would return OK:
root@debian:~# ./check_smart.pl -i auto -g "/dev/nvme[0-9]"
OK: [/dev/nvme0] - Device is clean --- [/dev/nvme1] - Device is clean|
With version 6.14.2, the plugin now correctly identifies a NVMe drive in combination with the -i auto flag and correctly warns:
root@debian:~# ./check_smart.pl -i auto -g "/dev/nvme[0-9]"
WARNING: [/dev/nvme0] - [/dev/nvme0] - Media_and_Data_Integrity_Errors is non-zero (114)[/dev/nvme0] - |
The bugfix from Yannick also has a positive outcome for the performance data, too. When checking a single drive (using -d instead of -g), performance data of the drive is shown in the output.
However before 6.14.2, the performance data for a NVMe drive in combination with -i auto would not show up:
root@debian:~# ./check_smart.pl -i auto -d "/dev/nvme0"
OK: Drive UCS-SDHPCIE 800GB S/N hidden: no SMART errors detected. |
Now with 6.14.2 this looks much better:
root@debian:~# ./check_smart.pl -i auto -d "/dev/nvme0"
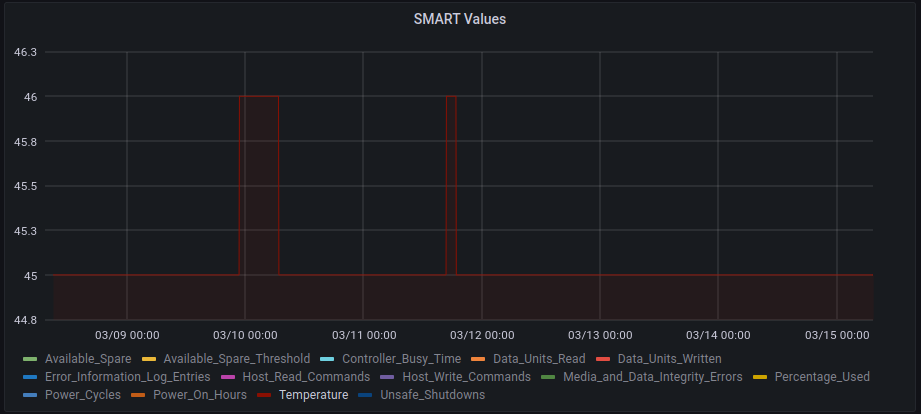
OK: Drive UCS-SDHPCIE 800GB S/N hidden: no SMART errors detected. |Temperature=45 Available_Spare=100 Available_Spare_Threshold=10 Percentage_Used=0 Data_Units_Read=193595329 Data_Units_Written=193011172 Host_Read_Commands=865341327 Host_Write_Commands=3438917475 Controller_Busy_Time=265560 Power_Cycles=57 Power_On_Hours=23962 Unsafe_Shutdowns=44 Media_and_Data_Integrity_Errors=0 Error_Information_Log_Entries=0
No comments yet.

AI AWS Android Ansible Apache Apple Atlassian BSD Backup Bash Bluecoat CMS Chef Cloud Coding Consul Containers CouchDB DB DNS Databases Docker ELK Elasticsearch Filebeat FreeBSD Galera Git GlusterFS Grafana Graphics HAProxy HTML Hacks Hardware Icinga Influx Internet Java KVM Kibana Kodi Kubernetes LVM LXC Linux Logstash Mac Macintosh Mail MariaDB Minio MongoDB Monitoring Multimedia MySQL NFS Nagios Network Nginx OSSEC OTRS Observability Office OpenSearch PHP Perl Personal PostgreSQL PowerDNS Proxmox Proxy Python Rancher Rant Redis Roundcube SSL Samba Seafile Security Shell SmartOS Solaris Surveillance Systemd TLS Tomcat Ubuntu Unix VMware Varnish Virtualization Windows Wireless Wordpress Wyse ZFS Znuny Zoneminder