
While working on the next release of check_ilorest, I noticed Prometheus scraping errors:
Nov 14 12:44:13 linux alloy[3329102]: ts=2025-11-14T11:44:13.328056317Z level=warn msg="Error on ingesting samples with different value but same timestamp" component_path=/ component_id=prometheus.scrape.script_check_ilorest scrape_pool=prometheus.scrape.script_check_ilorest target="http://localhost:9469/probe?script=check_ilorest" num_dropped=25
The error suggests, there are issues with ingesting samples with different values but with the same timestamp:
Error on ingesting samples with different value but same timestamp
In this situation, a locally installed Grafana Alloy daemon is using the Prometheus Scrape component to retrieve the metrics presented by Script Exporter, which in turn executes check_ilorest.
But it wouldn't actually matter if the scraping happens from Prometheus, Alloy or Otel Collector or any other scraper. This error would (most likely) be shown on all scrapers using the Prometheus Scraper in the background/embedded.
The previous version (1.1.0) did not run into such scraping errors, so it must have something to do with the changes I'm working on. These changes involve additional metrics, to show the server's power usage.
These show up at the end of the output, when the script was launched with -o prometheus:
$ sudo ./check_ilorest.py -o prometheus --power -m
[...]
#HELP ilorest_hardware_powerusage
#TYPE ilorest_hardware_powerusage gauge
ilorest_hardware_powerusage 328
#HELP ilorest_hardware_power_supply_usage{psu='1'}
#TYPE ilorest_hardware_power_supply_usage{psu='1'} gauge
ilorest_hardware_power_supply_usage{psu='1'} 132
#HELP ilorest_hardware_power_supply_usage{psu='2'}
#TYPE ilorest_hardware_power_supply_usage{psu='2'} gauge
ilorest_hardware_power_supply_usage{psu='2'} 196
A quick look through these metrics verifies that the metric names are not duplicated.
However Chat GPT came up with a pretty good and important hint:
HELP and TYPE lines must never contain labels.
Ugh! I made an ugly mistake! Inside a for loop in the script, which goes through the JSON data of each detected power supply, I added three lines in the Prometheus metrics output:
#HELP ilorest_hardware_power_supply_usage{psu='1'}
#TYPE ilorest_hardware_power_supply_usage{psu='1'} gauge
ilorest_hardware_power_supply_usage{psu='1'} 132
#HELP ilorest_hardware_power_supply_usage{psu='2'}
#TYPE ilorest_hardware_power_supply_usage{psu='2'} gauge
ilorest_hardware_power_supply_usage{psu='2'} 196
The output inside this loop also contained the #HELP and #TYPE lines. These are used to describe the metric, but also to tell Prometheus what kind of data the value is (gauge in this case). Obviously this resulted in a total of 6 lines, for two detected Power Supplies...
However a metric can only be described ONCE. The metric name is ilorest_hardware_power_supply_usage. The additional data inside the curly brackets "{ }" are additional labels. For the power supplies, I used these labels to identify the power supply number.
To fix this, I had to adjust the script to output the #HELP and #TYPE lines before the for loop and only output the actual metric with values for each power supply afterwards.
This then results in the following output:
#HELP ilorest_hardware_power_supply_usage
#TYPE ilorest_hardware_power_supply_usage gauge
ilorest_hardware_power_supply_usage{psu='1'} 129
ilorest_hardware_power_supply_usage{psu='2'} 197
Shortly after the Prometheus metrics output was fixed, the Prometheus scraper component of Alloy still complained.
Nov 14 12:59:16 linux alloy[3329102]: ts=2025-11-14T11:59:16.245180287Z level=warn msg="Error on ingesting samples with different value but same timestamp" component_path=/ component_id=prometheus.scrape.script_check_ilorest scrape_pool=prometheus.scrape.script_check_ilorest target="http://localhost:9469/probe?script=check_ilorest" num_dropped=25
This time, Chat GPT had no hint to give me. But from the previous response I saw that in all the metric examples the labels used double-quotes, not single quotes. In my code I used single-quotes to avoid having to escape them ^_^.
After a change to double-quotes in the output, the metrics now look like these:
$ sudo ./check_ilorest.py -o prometheus --power -m
[...]
#HELP ilorest_hardware_powerusage
#TYPE ilorest_hardware_powerusage gauge
ilorest_hardware_powerusage 326
#HELP ilorest_hardware_power_supply_usage
#TYPE ilorest_hardware_power_supply_usage gauge
ilorest_hardware_power_supply_usage{psu="1"} 129
ilorest_hardware_power_supply_usage{psu="2"} 197
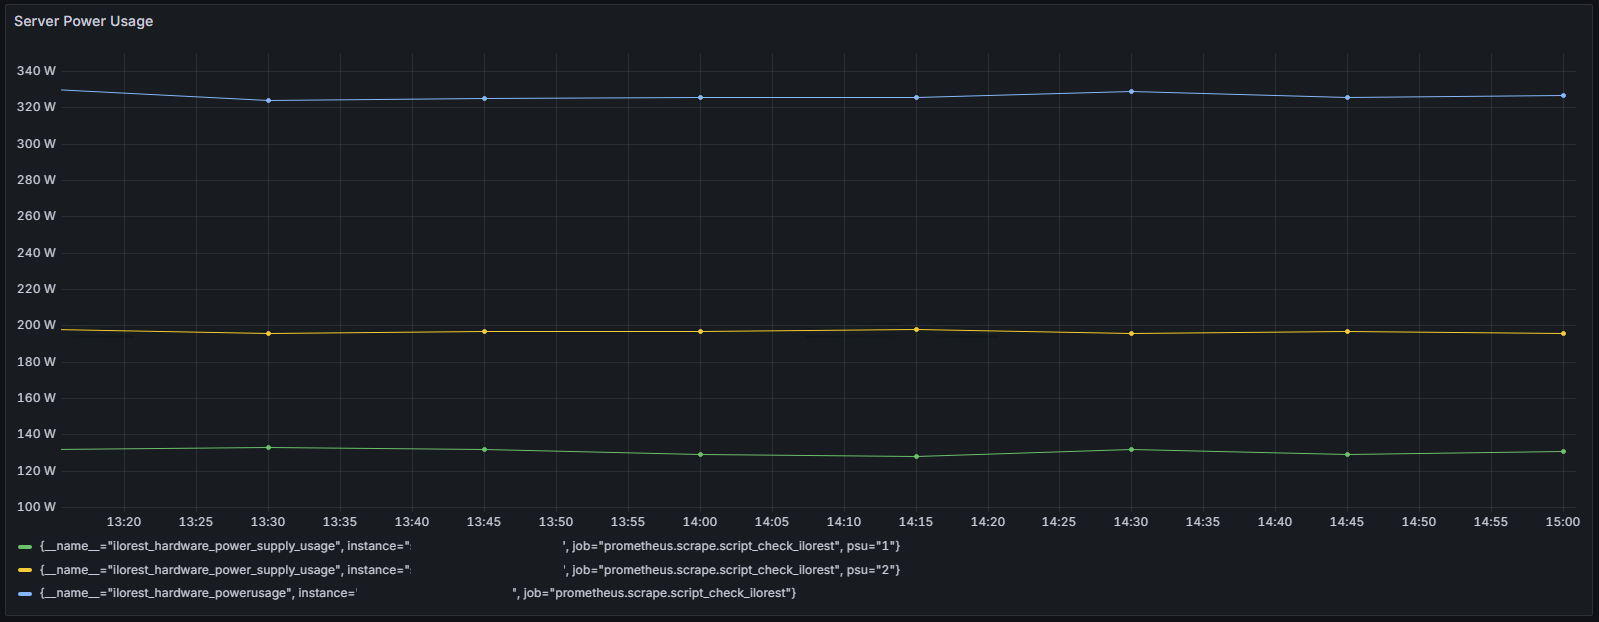
After this change, Alloy stopped logging ingestion errors and the data started showing up in the dashboards!
The Prometheus exposed metrics, including the HELP AND TYPE lines, must follow some rules. Or you run into scraping errors. Make sure your metrics:
No comments yet.

AI AWS Android Ansible Apache Apple Atlassian BSD Backup Bash Bluecoat CMS Chef Cloud Coding Consul Containers CouchDB DB DNS Databases Docker ELK Elasticsearch Filebeat FreeBSD Galera Git GlusterFS Grafana Graphics HAProxy HTML Hacks Hardware Icinga Influx Internet Java KVM Kibana Kodi Kubernetes LVM LXC Linux Logstash Mac Macintosh Mail MariaDB Minio MongoDB Monitoring Multimedia MySQL NFS Nagios Network Nginx OSSEC OTRS Observability Office OpenSearch PHP Perl Personal PostgreSQL PowerDNS Proxmox Proxy Python Rancher Rant Redis Roundcube SSL Samba Seafile Security Shell SmartOS Solaris Surveillance Systemd TLS Tomcat Ubuntu Unix VMware Varnish Virtualization Windows Wireless Wordpress Wyse ZFS Znuny Zoneminder