
Today I was looking for a method to monitor the incoming and outgoing traffic on Windows servers with Nagios.
An online search didn't find a lot of information or existing solutions so I dug into the documentation of NSClient++ (which is my favorite add-on to monitor Windows hosts in Nagios) and the following solution does the job:
/usr/local/nagios/libexec # ./check_nt -H mywindows -p 12489 -v COUNTER -l "\\Network Interface(VMware Accelerated AMD PCNet Adapter)\\Bytes Received/sec","Bytes_in/s %0.f"
Bytes_in/s 10164 | 'Bytes_in/s %0.f'=10163.700000%;0.000000;0.000000;
Important here is to understand how this works. I'll try to explain, so read carefully:
That we use the COUNTER check option of NSClient++ is obvious (-v COUNTER) but the important part comes now.
The COUNTER check uses the internal Windows performance counters to query them and get the current value. There are a lot, but what we're interested in is the performance object called 'Network Interface'.
COUNTER -l "\\Network Interface
It is important to select the correct network interface. Every existing interface on the server is represented as an 'instance'. If you don't know the instance/interface name of your network interface, take a look at the HINT section below. An instance can be selected by putting it into brackets right after the performance object:
COUNTER -l "\\Network Interface(VMware Accelerated AMD PCNet Adapter)
The next thing to do is to select the counter and get the current value from this counter (in this case the Bytes Received/sec):
COUNTER -l "\\Network Interface(VMware Accelerated AMD PCNet Adapter)\\Bytes Received/sec"
The value itself contains only a single number (in the example above 10164). To 'decorate' the output, a description can be added. Here I add the text 'Bytes_in/s' followed by the value:
COUNTER -l "\\Network Interface(VMware Accelerated AMD PCNet Adapter)\\Bytes Received/sec","Bytes_in/s %0.f"
And now you can go on and monitor your Windows network usage.
HINT
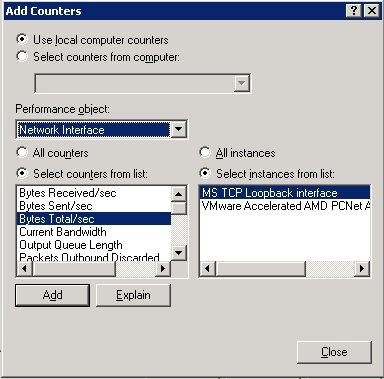
In case you don't have a clue what I'm talking about and to have a better understanding of performance objects, counters and instances, open 'Performance' in the 'Administrative Tools' and in the left navigation select the 'Counter Logs'. Then right-click on the existing 'System Overview' logs and select 'Properties'. In the new window click on the button 'Add Counters...'.
Now select 'Network Interface' in the list of Performance objects. In the left side the available counters will appear while on the right side the network interfaces will show up:
One problem I could not solve with this check is a combined output of Bytes Received/sec and Bytes Sent/sec in the same check. The goal in my case is to create an automatic graphic (with Nagiosgraph) based on the live network usage of the target Windows server. I created a new Nagios plugin called check_win_net_usage which makes use of check_nt. More information about check_win_net_usage soon.
ck from Switzerland wrote on May 6th, 2015:
Hi Cesar. It seems that check_nt does not get any real result. So you have to debug with the check_nt command to see why you get zeros back as values:
./check_nt -H 192.168.1.39 -p 12489 -v COUNTER -l "\\Network Interface(Broadcom NetLink (TM) Gigabit Ethernet)\\Bytes Received/sec","Bytes_in/s %0.f"
Cesar from Brasil wrote on May 6th, 2015:
the plugin's test, the result always returns to 0
root @ Stryke: / usr / lib / nagios / plugins # ./check_win_net_usage.sh -H 192.168.1.39 -p 12489 -i "Broadcom NetLink (TM) Gigabit Ethernet" -o KB
Network OK - 0 KBytes received / sec, 0 KBytes sent / sec | bytes_in = 0; bytes_out = 0
any suggestion?
Claudio from Switzerland wrote on Oct 2nd, 2013:
Hi Asprey. The warning thresholds are actually a good idea. Might add this in the next version. Concerning nagiosgraph you can pretty much use the same map entry as presented in http://www.claudiokuenzler.com/nagios-plugins/check_win_net_usage.php . If you have other data showing up in the graph, then it is mixed up with another map entry.
Asprey from wrote on Oct 2nd, 2013:
The check is very useful Thanks!!!!!
Dear Claudio
It's possible add the options Warning and critical in your plugin?
Another thing if you can.
How I can clean on the nagiosgraph to display only nt_net,in_Bps and nt_net,out_Bps??
Thanks in advanvce and sorry for my English
Claudio from Switzerland wrote on Mar 6th, 2013:
This is how I defined the check.
Service definiton:
# Check Network
define service{
use generic-service
host_name myhost
service_description Network Usage
check_command check_win_net_usage!"VMware Accelerated AMD PCNet Adapter"!-p 12489
}
Diego Rucci from Argentina wrote on Mar 6th, 2013:
Hi Claudio, thanks for fast response.
Indeed, I used typeperf.
I get the right name.
typeperf returns:
"\\Interfaz de red(Adaptador Ethernet PCI AMD PCNET Family - Minipuerto del administrador de paquetes)\\Bytes recibidos/s."
I run check_nt from command line and get right data.
Seems that my problem is defining service and command.
Nagios doesn't know how to parse my arguments.
I think I'm messing up things with last argument:
"\\Interfaz......Bytes recibidos/s.","Bytes_in/s $%0.f"
It's a full argument? They are 2 arguments?
How should I define command and service?
thanks!
Claudio from Switzerland wrote on Mar 6th, 2013:
Hi Diego,
Take a look at the comments below. Use the command typeperf.exe, mentioned in my comment on Oct 9th, 2012. It should give you the correct name of the interface to use.
Diego Rucci from Argentina wrote on Mar 6th, 2013:
Hi Claudio, Thank you for this tutorial.
I have an issue.
I already can reach network interfaces and pull bytes received and sent using check_nt plugin from command line.
(On windows clients I'm using NSClient++ and SNMP enabled)
I made the command and service but I get "UNKNOWN: could not parse arguments"
This is how my command is defined:
define command {
command_name check_net_in
command_line /usr/lib/nagios/plugins/check_nt -H '$HOSTADDRESS$' -s '$ARG1$' -p 12489 -v '$ARG2$' -l '$ARG3$',"Bytes_in/s %0.f"
}
This is how my service is declared:
define service{
use generic-service
host_name windowsbox
service_description Network Traffic Bytes IN
check_command check_net_in!
D PCNET Family - Minipuerto del administrador de paquetes)\\Total de bytes/s.
}
Last argument is in Spanish (as Windows names network interface)
I think problem is with interface name.
I have verified nagios (with -v option) and get 0 errors/warnings.
I've tried with double-quote (") single quote (') and without them.
How can I define network interfaces?
Any hint?
Thanks in advance
Hermit from Russia wrote on Oct 17th, 2012:
Hi! Thanks for you good script!
I want to advise to add useful condition to the script. Without this condition nagiosgraph is broken graph when nsclient don't answer.
75 if !([ "$bytes_in" -eq "$bytes_in" ]) 2>/dev/null ; then
76 echo "Can't get data"
77 exit 3
78 fi
79
80 # In case KB or MB has been set in -o option
Claudio from Switzerland wrote on Oct 10th, 2012:
I analyzed your output and there was a bug in check_win_net_usage.sh. I'll release a bugfix soon.
Claudio from Switzerland wrote on Oct 10th, 2012:
Please run the plugin with the following command:
/bin/bash -xv check_win_net_usage.sh -H 135.244.35.152 -p 12489 -i "Intel[R] 82579LM Gigabit Network Connection - Alcatel-Lucent VPN Miniport"
Then send me the output by e-mail (use contact-form in About page).Abhi from India wrote on Oct 10th, 2012:
Hi Claudio, After changing use_file parameter, I am able to get output of below command. Really appreciate your help.
RALFroot#./check_nt -H 135.244.35.152 -p 12489 -v COUNTER -l "\\Network Interface(Intel[R] 82579LM Gigabit Network Connection - Alcatel-Lucent VPN Miniport)\Bytes Total/sec","Bytes_in/s %0.f" Bytes_in/s 10164
Bytes_in/s 53 | 'Bytes_in/s %0.f'=52.709800%;0.000000;0.000000;
===========================================
Now I am trying your bundle check_win_net_usage. so that I can get this on my web interface of Nagios. But getting following usage error. Appreciate if you can look on that...
=========================
RALFroot#./check_win_net_usage.sh -H 135.244.35.152 -p 12489 -i "Intel[R] 82579LM Gigabit Network Connection - Alcatel-Lucent VPN Miniport"
Network OK - check_nt: Could not parse arguments
Usage:
check_nt -H host -v variable [-p port] [-w warning] [-c critical]
[-l params] [-d SHOWALL] [-u] [-t timeout] Bytes received/sec, check_nt: Could not parse arguments
Usage:
check_nt -H host -v variable [-p port] [-w warning] [-c critical]
[-l params] [-d SHOWALL] [-u] [-t timeout] Bytes sent/sec|bytes_in=check_nt: Could not parse arguments
Usage:
check_nt -H host -v variable [-p port] [-w warning] [-c critical]
[-l params] [-d SHOWALL] [-u] [-t timeout];bytes_out=check_nt: Could not parse arguments
Usage:
check_nt -H host -v variable [-p port] [-w warning] [-c critical]
[-l params] [-d SHOWALL] [-u] [-t timeout]
RALFroot#
Claudio from Switzerland wrote on Oct 10th, 2012:
So now compare the names of the NIC which you want to use in the check command:
Used by you: INTEL[R]82579LM Gigabit Network Connection - Alcatel-Lucent VPN Miniport
Output of typeperf: Intel[R] 82579LM Gigabit Network Connection - Alcatel-Lucent VPN Miniport
Did you notice that Intel[R] 82579LM is written differently? And this one should work.
Abhi from India wrote on Oct 9th, 2012:
appreciate it...
the one starting with "#" is the interface card that I am giving in command
=========================================
RALFroot#./check_nt -H 135.244.43.253 -p 12489 -v COUNTER -l "\\Network Interface(Intel[R] 82579LM Gigabit Network Connection - Alcatel-Lucent VPN Miniport)\Bytes Received/sec"
CRITICAL - Socket timeout after 10 seconds
========================
C:\Program Files\NSClient++>typeperf.exe -qx | find "Network Interface"
RSVP Service(Service)\Network Interfaces
Network Interface(Bluetooth LAN Access Server Driver - McAfee NDIS Intermediate
Filter Miniport)\Bytes Total/sec
Network Interface(Intel[R] Centrino[R] Advanced-N 6205 - McAfee NDIS Intermedia
te Filter Miniport)\Bytes Total/sec
Network Interface(Intel[R] 82579LM Gigabit Network Connection - Alcatel-Lucent
VPN Miniport)\Bytes Total/sec
Network Interface(MS TCP Loopback interface)\Bytes Total/sec
Network Interface(Bluetooth LAN Access Server Driver - McAfee NDIS Intermediate
Filter Miniport)\Packets/sec
Network Interface(Intel[R] Centrino[R] Advanced-N 6205 - McAfee NDIS Intermedia
te Filter Miniport)\Packets/sec
Claudio from Switzerland wrote on Oct 9th, 2012:
I just tried it myself with NSClient++ 0.3.9 and latest 4.x version and I had troubles myself.
I suggest you use the following command to let Windows tell you the correct interface name:
typeperf.exe -qx | find "Network Interface"
typeperf.exe -qx | find "Network Interface" > C:\tmp\netintcounter.txt
Abhi from India wrote on Oct 9th, 2012:
I changed the use_file parameter to 0. Below is the output I recieved.
=========================================
C:\\\\\\\\Program Files\\\\\\\\NSClient++>nsclient++.exe sys --list --counter \\\\\\\"Network Interfa
ce\\\\\\\"
d NSClient++.cpp(557) Attempting to start NSCLient++ - 0.3.9.327 2011-08-16
e NSClient++.cpp(1334) Failed to set settings fileNo settings method specified,
cannot start
e NSClient++.cpp(568) Could not find settings: No settings method specified, can
not start
l NSClient++.cpp(909) Module (sys) was not found: Could not load library: 126: T
he specified module could not be found.
l NSClient++.cpp(917) Module (sys.dll) was not found: Could not load library: 12
6: The specified module could not be found.
e NSClient++.cpp(919) Module not found: sys available modules are:
d NSClient++.cpp(764) Attempting to stop NSCLient++ - 0.3.9.327 2011-08-16
d NSClient++.cpp(767) Stopping: NON Message Handling Plugins
d NSClient++.cpp(775) Stopping: COM helper
d NSClient++.cpp(783) Stopping: Socket Helpers
e NSClient++.cpp(787) Socket exception: WSACleanup failed: 10093: Either the app
lication has not called WSAStartup, or WSAStartup failed.
d NSClient++.cpp(791) Stopping: Settings instance
d NSClient++.cpp(815) Stopping: Message handling Plugins
d NSClient++.cpp(822) NSCLient++ - 0.3.9.327 2011-08-16 Stopped succcessfully
Claudio from Switzerland wrote on Oct 9th, 2012:
You need to stop NSClient++ daemon before you launch it by hand...
Abhi from India wrote on Oct 9th, 2012:
Thankyou Claudio for the link provided. I have NSClient 0.3.9 installed.
==============================
C:\\\\Program Files\\\\NSClient++>nsclient++.exe sys --list --counter \\\"Network Interface\\\"
d NSClient++.cpp(557) Attempting to start NSCLient++ - 0.3.9.327 2011-08-16
NSCore not loaded...
Archiving crash dumps in: D:\\\\Documents and Settings\\\\abhimash\\\\Local Settings\\\\Appl
ication Data\\\\NSClient++\\\\crash dumps
l \\\\FileLogger.cpp(87) Log path is: C:\\\\Program Files\\\\NSClient++\\\\\\\\nsclient.log
e \\\\Socket.h(691) bind failed: 10048: Only one usage of each socket address (prot
ocol/network address/port) is normally permitted.
e \\\\Socket.h(691) bind failed: 10048: Only one usage of each socket address (prot
ocol/network address/port) is normally permitted.
l NSClient++.cpp(909) Module (sys) was not found: Could not load library: 126: T
he specified module could not be found.
e \\\\Socket.h(722) Socket did not start properly, we will now do nothing...
e \\\\Socket.h(722) Socket did not start properly, we will now do nothing...
l NSClient++.cpp(917) Module (sys.dll) was not found: Could not load library: 12
6: The specified module could not be found.
e NSClient++.cpp(919) Module not found: sys available modules are: CheckDisk, Ch
eckEventLog, CheckExternalScripts, CheckHelpers, CheckNSCP, CheckSystem, CheckTa
skSched, FileLogger, LUAScript, NRPEClient, NRPEListener, NSCAAgent, NSClientLis
tener, SysTray
e NSClient++.cpp(1352) Failed to set settings fileNo settings manager found have
you configured.
Claudio from Switzerland wrote on Oct 9th, 2012:
Try directly on the Windows host:
nscp client --module CheckSystem --exec listpdh
or
nscp sys --list --counter "Network Interface"
Again, take a look at http://www.nsclient.org/nscp/discussion/message/2702 .
Abhi from India wrote on Oct 9th, 2012:
Sorry for late response, I installed check_nrpe addon, getting below error
RALFroot#/opt/Nagios/libexec/check_nrpe -n -t 60 -H 135.244.43.253 -c listCounterInstances -a \"Network Interface\"
ERROR: Failed to enumerate counter instances: RESOLVER: EnumObjectInstances: Could not find index: Network Interface : The specified object is not found on the system. (C0000BB8)
RALFroot#
=============================
nelow are the packages version installed on my server
nagios-3.4.1
nagios-plugins-1.4.16
nrpe-2.13
on windows desktop
NSClient++-0.3.9-Win32
Claudio from Switzerland wrote on Oct 9th, 2012:
This is not a socket error, it's a timeout. That's a big difference.
It looks like it can't find the network interface "INTEL[R]82579LM Gigabit Network Connection - Alcatel-Lucent VPN Miniport". Make sure the name is correct. Some characters may look different in the system than in the performance GUI. For example an asterisk (*) is written as underscore (_).
With NSClient++ 3.x do the following:
check_nrpe -n -t 60 -H myhost -c listCounterInstances -a "Network Interface"
nscp sys --list --counter "Network Interface"
Abhi from wrote on Oct 9th, 2012:
It still says socket error.
=========
RALFroot#./check_nt -H 172.21.236.179 -p 12489 -v COUNTER -l "\\Network Interface(INTEL[R]82579LM Gigabit Network Connection - Alcatel-Lucent VPN Miniport)\\Bytes Received/sec"
CRITICAL - Socket timeout after 10 seconds
RALFroot#
RALFroot#./check_nt -H 172.21.236.179 -p 12489 -v COUNTER -l "\\Network Interface(INTEL[R]82579LM Gigabit Network Connection - Alcatel-Lucent VPN Miniport)\\Bytes Sent/sec"
CRITICAL - Socket timeout after 10 seconds
However check_nt working fine for showing cpu load and other default services outputs
Claudio from Switzerland wrote on Oct 9th, 2012:
Does it work without formatting the result? Just leave away the following part: ,"Bytes_in/s %0.f"
What is the Shell you're using with your local user? Looks like ksh and this triggers some problems. Launch another shell like bash and try it there, too.
Abhi from India wrote on Oct 9th, 2012:
I tried without modifying the mentioned command but it says
./check_nt -H 172.21.236.179 -p 12489 -v COUNTER -l \"\\\\Network Interface(INTEL[R]82579LM Gigabit Network Connection - Alcatel-Lucent VPN Miniport)\\\\Bytes Received/sec\",\"Bytes_in/s %0.f\"
Bytes_in/s 10164 | \'Bytes_in/s %0.f\'=10163.700000%;0.000000;0.000000;
-ksh: Bytes_in/s %0.f=10163.700000%: not found [No such file or directory]
-ksh: 0.000000: not found [No such file or directory]
-ksh: 0.000000: not found [No such file or directory]
===============================
Will Nagios Plugin/Wrapper check_win_net_usage work as I am still having issues with check_nt? Please advice
Claudio from Switzerland wrote on Oct 9th, 2012:
Hello Abhi,
Try it without formatting the result. You should already get a result with this command:
check_nt -H 172.21.236.179 -p 12489 -v COUNTER -l "\\Network Interface(INTEL[R]82579LM Gigabit Network Connection - Alcatel-Lucent VPN Miniport)\\Bytes Sent/sec"
Abhi from India wrote on Oct 9th, 2012:
Hi,
I am new to Nagios, trying to monitor network traffic and tried your steps mentioned above. Below are few errors which I have recieved. I really appreciate if you can help me to clear them out.
./check_nt -H 172.21.236.179 -p 12489 -v COUNTER -l "\\Network Interface(INTEL[R]82579LM Gigabit Network Connection - Alcatel-Lucent VPN Miniport)\\Bytes Received/sec","Bytes_in/s %0.f"
Bytes_in/s 10164 | 'Bytes_in/s %0.f'=10163.700000%;0.000000;0.000000;
-ksh: Bytes_in/s %0.f=10163.700000%: not found [No such file or directory]
-ksh: 0.000000: not found [No such file or directory]
-ksh: 0.000000: not found [No such file or directory]
./check_nt -H 172.21.236.179 -p 12489 -v COUNTER -l "\\Network Interface(INTEL[R]82579LM Gigabit Network Connection - Alcatel-Lucent VPN Miniport)\\Bytes Received/sec","Bytes_in/s %0.f"Bytes_in/s 10164
CRITICAL - Socket timeout after 10 seconds
Below modules are in ini file
[modules]
NRPEListener.dll
NSClientListener.dll
NSCAAgent.dll
FileLogger.dll
CheckSystem.dll
CheckDisk.dll
CheckEventLog.dll
CheckHelpers.dll
FileLogger.dll
CheckSystem.dll
CheckDisk.dll
NSClientListener.dll
NRPEListener.dll
SysTray.dll
CheckEventLog.dll
CheckHelpers.dll
;CheckWMI.dll
CheckNSCP.dll
;
; Script to check external scripts and/or internal aliases.
CheckExternalScripts.dll
;
; NSCA Agent if you enable this NSClient++ will talk to NSCA hosts repeatedly (so dont enable unless you want to use NSCA)
NSCAAgent.dll
;
; LUA script module used to write your own \"check deamon\".
LUAScript.dll
;
; RemoteConfiguration IS AN EXTREM EARLY IDEA SO DONT USE FOR PRODUCTION ENVIROMNEMTS!
;RemoteConfiguration.dll
; Check other hosts through NRPE extreme beta and probably a bit dangerous! :)
NRPEClient.dll
; Extreamly early beta of a task-schedule checker
CheckTaskSched.dll
===============================================================
PLease advise what else I am missing to monitor network traffic

AI AWS Android Ansible Apache Apple Atlassian BSD Backup Bash Bluecoat CMS Chef Cloud Coding Consul Containers CouchDB DB DNS Databases Docker ELK Elasticsearch Filebeat FreeBSD Galera Git GlusterFS Grafana Graphics HAProxy HTML Hacks Hardware Icinga Influx Internet Java KVM Kibana Kodi Kubernetes LVM LXC Linux Logstash Mac Macintosh Mail MariaDB Minio MongoDB Monitoring Multimedia MySQL NFS Nagios Network Nginx OSSEC OTRS Observability Office OpenSearch PHP Perl Personal PostgreSQL PowerDNS Proxmox Proxy Python Rancher Rant Redis Roundcube SSL Samba Seafile Security Shell SmartOS Solaris Surveillance Systemd TLS Tomcat Ubuntu Unix VMware Varnish Virtualization Windows Wireless Wordpress Wyse ZFS Znuny Zoneminder