
Over the past few years I have seen a lot of disks failing. Usually they're in a RAID setup, so that isn't too bad. But if you're not aware of a failing disk and wait too long, another disk in the same RAID array could be failing, too. That's why monitoring physical hard drives is essential for every sys admin!
Depending on the way you chose to monitor your hardware and therefore your hard drives, the check results can vary a lot. For older servers (running FreeBSD with ZFS) I am using a three way monitoring:
check_smart was the first monitoring plugin detecting a problem with a hard drive at the begin of March:
[06-03-2014 17:32:13] SERVICE ALERT: myserver;Disk SMART Status cciss2;WARNING;SOFT;1;WARNING: 8 Elements in grown defect list (threshold 3)
From this day on, the number of elements in the grown defect list increased. Because I and my colleagues are curious we wanted to know, how many defect elements it would take until the disk completely fails. We needed patience...
More than a month later, the number of elements went over 2000 and the drive finally had a real SMART error:
[21-04-2014 06:48:40] SERVICE ALERT: myserver;Disk SMART Status cciss2;CRITICAL;HARD;3;CRITICAL: Health status: FAILURE PREDICTION THRESHOLD EXCEEDED: ascq=0x5 [asc=5d, ascq=5], 2028 Elements in grown defect list (threshold 9)
At almost the same time, the ILO check detected the SMART error, too and returned the alert:
[21-04-2014 06:41:30] SERVICE ALERT: myserver;Hardware;CRITICAL;HARD;3;ILO2_HEALTH CRITICAL - (Board-Version: ILO2) Drive Bay 1 3: Smart Error
Two hardware checks are indicating SMART errors now, but at that moment, ZFS still displayed the drive as "ONLINE".
It took another two days until ZFS finally became aware of the failing drive and tagged it as DEGRADED:
[23-04-2014 07:54:33] SERVICE ALERT: myserver;ZFS Pools;CRITICAL;HARD;3;ZFS POOL ALARM: dbpool health is DEGRADED
The following graphic shows the curve of the increased numbers in the bad element list and when the plugins detected a warning/failure:
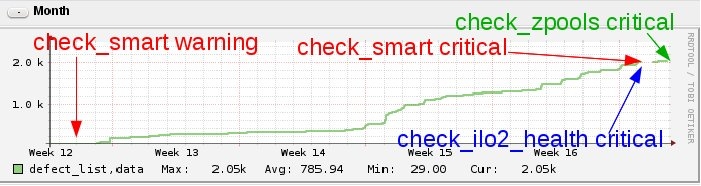
This proves that, if possible, use as many hardware checks as you can. Thanks to check_smart we already knew far in advance that this disk is soon going to die and could order a replacement disk already weeks ago.
Francois Scheurer from wrote on Apr 24th, 2014:
Thx Claudio for your scripts.
Also interesting in this topic: http://serverfault.com/a/519787/123733
google discovered that many failure were not detected by SMART in advance (about 70%)

AI AWS Android Ansible Apache Apple Atlassian BSD Backup Bash Bluecoat CMS Chef Cloud Coding Consul Containers CouchDB DB DNS Databases Docker ELK Elasticsearch Filebeat FreeBSD Galera Git GlusterFS Grafana Graphics HAProxy HTML Hacks Hardware Icinga Influx Internet Java KVM Kibana Kodi Kubernetes LVM LXC Linux Logstash Mac Macintosh Mail MariaDB Minio MongoDB Monitoring Multimedia MySQL NFS Nagios Network Nginx OSSEC OTRS Observability Office OpenSearch PHP Perl Personal PostgreSQL PowerDNS Proxmox Proxy Python Rancher Rant Redis Roundcube SSL Samba Seafile Security Shell SmartOS Solaris Surveillance Systemd TLS Tomcat Ubuntu Unix VMware Varnish Virtualization Windows Wireless Wordpress Wyse ZFS Znuny Zoneminder