
This is a follow-up article on my previous post (Docker container syslog logs not appearing in ELK Kibana (different timezone)). I had the problem that a Docker container, which runs HAProxy, sent its logs in UTC (because the container's timezone was set in UTC). But the receiving Logstash server (running in UTC+2) thought it had to subtract two hours again. Which resulted in a time gap of 4 hours. The log was received at 13:38 UTC+2, the entry was inserted into Elasticseach as 09:38 UTC:
Aug 25 13:38:00 inf-elk01-t logstash[8657]: "@timestamp" => 2017-08-25T09:38:00.000Z,
To tackle this problem, I had to get myself a bit into the Logstash filters and their possibilities. But first let me outline the setup so the configs make sense at last.
Usually my HAProxy machines run as VM's or inside a Linux container (LXC). HAProxy writes local log files which are then parsed by Filebeat and sent to Logstash (see article Install and configure Elastic Filebeat through Ansible for additional information on that). As you can see on that article, Filebeat appends the "document_type" with the value "haproxy".
In the Docker environment, which runs on Rancher, we use the Rancher-internal load balancer service. As this is based on a container image we cannot interfere with, the only way to get the HAProxy logs from within the container is to modify the HAProxy config. In Rancher this can be done by using the column "custom haproxy.cfg". Entries in there will be merged with the dynamically created configuration. I added the relevant parts for the logging:
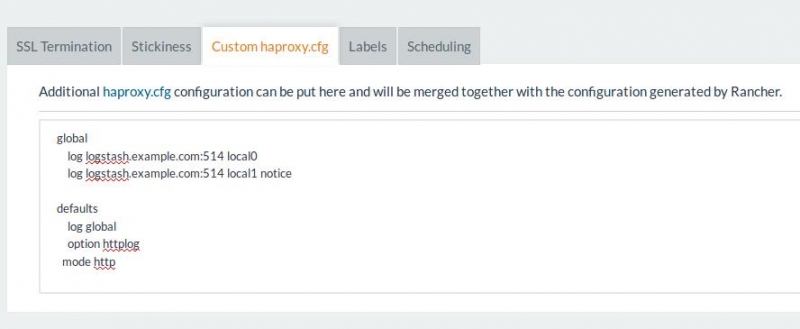
global
log logstash.example.com:514 local0
log logstash.example.com:514 local1 notice
defaults
log global
option httplog
mode http
HAProxy allows logging to a central syslog server via IP and UDP port. So in this case I configured rsyslog on the Logstash machine (logstash.example.com) to listen to and receive syslog messages.
On the Logstash machine, the central syslog server forwards into Logstash (which listens on port 10514):
root@logstash:~# cat /etc/rsyslog.d/01-json.conf
template(name="json-template"
type="list") {
constant(value="{")
constant(value="\"@timestamp\":\"") property(name="timereported" dateFormat="rfc3339")
constant(value="\",\"@version\":\"1")
constant(value="\",\"message\":\"") property(name="msg" format="json")
constant(value="\",\"sysloghost\":\"") property(name="hostname")
constant(value="\",\"severity\":\"") property(name="syslogseverity-text")
constant(value="\",\"facility\":\"") property(name="syslogfacility-text")
constant(value="\",\"programname\":\"") property(name="programname")
constant(value="\",\"procid\":\"") property(name="procid")
constant(value="\"}\n")
}
root@logstash:~# cat /etc/rsyslog.d/99-remote.conf
*.* @localhost:10514;json-template
On the Logstash server, the listener port 10514 is defined as a listener (input) and received messages are labeled as type "rsyslog":
# This input block will listen on port 10514 for logs to come in.
# host should be an IP on the Logstash server.
# codec => "json" indicates that we expect the lines we're receiving to be in JSON format
# type => "rsyslog" is an optional identifier to help identify messaging streams in the pipeline.
input {
udp {
host => "0.0.0.0"
port => 10514
codec => "json"
type => "rsyslog"
}
}
Therefore in this ELK stack there are two ways HAProxy logs are being received and written into Elasticseach:
As I wrote at the begin, the Docker containers run in UTC (and the image cannot be changed), all other machines run in UTC+2. With that knowledge, the HAProxy config for Logstash can be adjusted (original grok filter for HAProxy found on logz.io):
root@logstash:~# cat /etc/logstash/conf.d/13-haproxy-filter.conf
filter {
grok {
match => [
"message", "%{IP:client_ip}:%{NUMBER:client_port:int} \[%{NOTSPACE:haproxy_timestamp}] %{NOTSPACE:frontend_name} %{NOTSPACE:backend_name}/%{NOTSPACE:server_name} %{NUMBER:time_queue:int}/%{NUMBER:time_backend_connect:int}/%{NUMBER:time_duration:int} %{NUMBER:bytes_read:int} %{NOTSPACE:termination_state} %{NUMBER:actconn:int}/%{NUMBER:feconn:int}/%{NUMBER:beconn:int}/%{NUMBER:srvconn:int}/%{NUMBER:retries:int} %{NUMBER:srv_queue:int}/%{NUMBER:backend_queue:int}" ,
"message" , "%{IP:client_ip}:%{NUMBER:client_port:int} \[%{NOTSPACE:haproxy_timestamp}\] %{NOTSPACE:frontend_name} %{NOTSPACE:backend_name}/%{NOTSPACE:server_name} %{NUMBER:time_client_req:int}/%{NUMBER:time_queue:int}/%{NUMBER:time_backend_connect:int}/%{NUMBER:time_server_response:int}/%{NUMBER:time_duration:int} %{NUMBER:status_code:int} %{NUMBER:bytes_read:int} %{NOTSPACE:captured_request_cookie} %{NOTSPACE:captured_response_cookie} %{NOTSPACE:termination_state_with_cookie_status} %{NUMBER:actconn:int}/%{NUMBER:feconn:int}/%{NUMBER:beconn:int}/%{NUMBER:srvconn:int}/%{NUMBER:retries:int} %{NUMBER:srv_queue:int}/%{NUMBER:backend_queue:int}?( \"%{GREEDYDATA:full_http_request}\")?( %{NOTSPACE:captured_response_headers})?"
]
}
if [type] == "rsyslog" {
date {
match => [ "haproxy_timestamp", "dd/MMM/yyyy:HH:mm:ss.SSS" ]
timezone => "UTC"
}
}
if [type] == "haproxy" {
date {
match => [ "haproxy_timestamp", "dd/MMM/yyyy:HH:mm:ss.SSS" ]
}
}
grok {
match => [
"full_http_request", "%{WORD:http_verb} %{URIPATHPARAM:http_request}?( HTTP/%{NUMBER:http_version})" ,
"full_http_request", "<%{WORD:http_request}>"
]
remove_field => [ "full_http_request" ]
}
}
As you can see I added two if conditions into the config file:
Also important to note here: The haproxy_timestamp field is being used here as date/time field (not the actual message time).
Since that modification, I have now both HAProxy logs in the same time zone and can compare them directly in graphs.
Update from March 19th 2020
Back when I wrote the article in 2017, I was using different log handlers to separate HAProxy logs: Local logging and filebeat for HAProxy installations on VM's, Direct logging to a central syslog server for HAProxy installations in Docker containers.
In the meantime I moved away from that setup and unified the logging of all HAProxy installations: They all log to a central syslog server now.
To identify whether or not the log came from a container, I added a condition in Logstash filter which checks for the field "sysloghost". All our Docker hosts follow a certain nomenclature (*rado*), therefore syslog logs from these hosts can be identified using a regular expression on the sysloghost field:
ck@logstash:~$ cat /etc/logstash/conf.d/13-filter-haproxy.conf
filter {
if [programname] == "haproxy" or [type] == "haproxy" {
# Make sure we use the same type "syslog" for all HAProxy logs, otherwise we run into ElasticSearch 6 problem:
# Rejecting mapping update to [haproxy-2018.09.05] as the final mapping would have more than 1 type: [log, syslog]
mutate { replace => { "type" => "syslog" } }
grok {
match => [
"message", "%{IP:client_ip}:%{NUMBER:client_port:int} \[%{NOTSPACE:haproxy_timestamp}] %{NOTSPACE:frontend_name} %{NOTSPACE:backend_name}/%{NOTSPACE:server_name} %{NUMBER:time_queue:int}/%{NUMBER:time_backend_connect:int}/%{NUMBER:time_duration:int} %{NUMBER:bytes_read:int} %{NOTSPACE:termination_state} %{NUMBER:actconn:int}/%{NUMBER:feconn:int}/%{NUMBER:beconn:int}/%{NUMBER:srvconn:int}/%{NUMBER:retries:int} %{NUMBER:srv_queue:int}/%{NUMBER:backend_queue:int}" ,
"message" , "%{IP:client_ip}:%{NUMBER:client_port:int} \[%{NOTSPACE:haproxy_timestamp}\] %{NOTSPACE:frontend_name} %{NOTSPACE:backend_name}/%{NOTSPACE:server_name} %{NUMBER:time_client_req:int}/%{NUMBER:time_queue:int}/%{NUMBER:time_backend_connect:int}/%{NUMBER:time_server_response:int}/%{NUMBER:time_duration:int} %{NUMBER:status_code:int} %{NUMBER:bytes_read:int} %{NOTSPACE:captured_request_cookie} %{NOTSPACE:captured_response_cookie} %{NOTSPACE:termination_state_with_cookie_status} %{NUMBER:actconn:int}/%{NUMBER:feconn:int}/%{NUMBER:beconn:int}/%{NUMBER:srvconn:int}/%{NUMBER:retries:int} %{NUMBER:srv_queue:int}/%{NUMBER:backend_queue:int}?( \"%{GREEDYDATA:full_http_request}\")?( %{NOTSPACE:captured_response_headers})?"
]
}
grok {
match => [
"full_http_request", "%{WORD:http_verb} %{URIPATHPARAM:http_request}?( HTTP/%{NUMBER:http_version})" ,
"full_http_request", "<%{WORD:http_request}>"
]
remove_field => [ "full_http_request" ]
}
if [sysloghost] =~ /^.*rado.*$/ {
# We received this HAProxy log from Docker where they all run with UTC
date {
match => [ "haproxy_timestamp", "dd/MMM/yyyy:HH:mm:ss.SSS" ]
timezone => "UTC"
}
}
}
}
Ferchimi from Argentina wrote on Oct 28th, 2021:
This was very useful, you saved me on openshift router logs: they're UTC and we are on ART (UTC-3). Thank you very much, Fernando

AI AWS Android Ansible Apache Apple Atlassian BSD Backup Bash Bluecoat CMS Chef Cloud Coding Consul Containers CouchDB DB DNS Databases Docker ELK Elasticsearch Filebeat FreeBSD Galera Git GlusterFS Grafana Graphics HAProxy HTML Hacks Hardware Icinga Influx Internet Java KVM Kibana Kodi Kubernetes LVM LXC Linux Logstash Mac Macintosh Mail MariaDB Minio MongoDB Monitoring Multimedia MySQL NFS Nagios Network Nginx OSSEC OTRS Observability Office OpenSearch PHP Perl Personal PostgreSQL PowerDNS Proxmox Proxy Python Rancher Rant Redis Roundcube SSL Samba Seafile Security Shell SmartOS Solaris Surveillance Systemd TLS Tomcat Ubuntu Unix VMware Varnish Virtualization Windows Wireless Wordpress Wyse ZFS Znuny Zoneminder