
When Elasticsearch experiences a disk full event, its "defense mechanism" is to try to move shards to another cluster member or, when nothing helps, set its indexes to read-only.
By default Elasticsearch starts to react at 85% disk usage (filesystem usage). To change the thresholds, the parameters "cluster.routing.allocation.disk.watermark" can be used. I already wrote about this in an older article "ElasticSearch stopped to assign shards due to low disk space" back in December 2017. Back then I was using Elasticsearch 5.x.
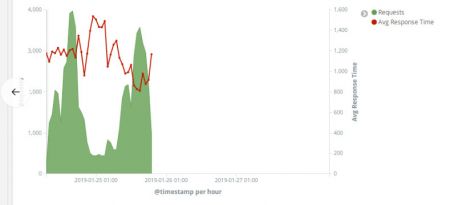
This morning I came across a similar issue with Elasticsearch 6.5.4. In Kibana no new log entries were shown; the last entries were from Friday evening:
When I looked at the Elasticsearch log files, I found a lot of lines like this one:
[2019-01-28T08:52:55,038][ERROR][o.e.x.w.e.ExecutionService] [inf-elkesi01-p] could not store triggered watch with id [prOmO-8rSreTrgLGraNv6w_kibana_version_mismatch_672f0d26-e20b-40d0-a54c-006543689e7c-2019-01-28T07:52:55.036Z]: [ClusterBlockException[blocked by: [FORBIDDEN/12/index read-only / allow delete (api)];]]
So Elasticsearch decided to set the read-only flag. But why? Although disk usage was at 96%, I remembered that we set different watermark thresholds based on units, not percentage:
# df -h | grep elastic
/dev/mapper/vges-lves ext4 3.9T 3.7T 168G 96% /var/lib/elasticsearch
# grep watermark /etc/elasticsearch/elasticsearch.yml
#cluster.routing.allocation.disk.watermark.low: "95%"
# 20180719: Set new watermarks
cluster.routing.allocation.disk.watermark.low: "100G"
cluster.routing.allocation.disk.watermark.high: "50G"
cluster.routing.allocation.disk.watermark.flood_stage: "10G"
Elasticsearch should only start to be aware of high disk usage when there's only 100GB left, yet it seems that the defaults were used. According to the documentation:
cluster.routing.allocation.disk.watermark.low
Controls the low watermark for disk usage. It defaults to 85%
cluster.routing.allocation.disk.watermark.high
Controls the high watermark. It defaults to 90%
cluster.routing.allocation.disk.watermark.flood_stage
Controls the flood stage watermark. It defaults to 95%, meaning that Elasticsearch enforces a read-only index block on every index
Even though the watermark thresholds were defined in elasticsearch.yml, the cluster settings didn't show it:
# curl -s http://localhost:9200/_cluster/settings -u elastic:XXX
{"persistent":{},"transient":{}}
Note: I'm actually not sure if the parameters defined in the config file are supposed to show up in the API. Maybe this is normal. Couldn't find any info for this.
So I decided to tell the Elasticsearch cluster using the API:
# curl -X PUT -H "Content-Type: application/json" http://localhost:9200/_cluster/settings -u elastic:XXX -d '{ "persistent": { "cluster.routing.allocation.disk.watermark.low": "100gb", "cluster.routing.allocation.disk.watermark.high": "50gb", "cluster.routing.allocation.disk.watermark.flood_stage": "10gb", "cluster.info.update.interval": "1m" } }'
{"acknowledged":true,"persistent":{"cluster":{"routing":{"allocation":{"disk":{"watermark":{"low":"100gb","flood_stage":"10gb","high":"50gb"}}}},"info":{"update":{"interval":"1m"}}}},"transient":{}}
Note: I used a "persistent" setting to survive cluster restarts.
The watermark thresholds now show up in the API:
# curl -s http://localhost:9200/_cluster/settings -u elastic:XXX
{"persistent":{"cluster":{"routing":{"allocation":{"disk":{"watermark":{"low":"100gb","flood_stage":"10gb","high":"50gb"}}}},"info":{"update":{"interval":"1m"}}}},"transient":{}}
But the cluster is still read only at this time. I decided to manually delete some older indexes and freed quite some space:
# df -h | grep elastic
/dev/mapper/vges-lves ext4 3.9T 3.6T 279G 93% /var/lib/elasticsearch
So we're far away from the thresholds now yet still no new data.
I tried a full restart of the cluster and waited until the cluster was green again. But still, no data coming in. Logstash reports:
[2019-01-28T11:00:56,068][INFO ][logstash.outputs.elasticsearch] retrying failed action with response code: 403 ({"type"=>"cluster_block_exception", "reason"=>"blocked by: [FORBIDDEN/12/index read-only / allow delete (api)];"})
On my research I came across a blog post and this shed some lights into the read-only situation:
" [...] elasticsearch is switching to read-only if it cannot index more documents because your hard drive is full [...] Elasticsearch will not switch back automatically [...] "
Oh? So I basically need to tell Elasticsearch "hey, you're good and stop being read-only"? Let's do this:
# curl -XPUT -H "Content-Type: application/json" http://localhost:9200/_all/_settings -d '{"index.blocks.read_only_allow_delete": null}' -u elastic:XXX
{"acknowledged":true}
Right after this, data started to arrive in ES again!
To sum it up, there are two issues and solutions here:
1) The watermark thresholds from the Elasticsearch config file were obviously ignored. As we have a support contract with ES, I will ask in a ticket why this happened. To work around this for now, I defined the thresholds manually in the Elasticsearch API using the persistent settings.
2) When Elasticsearch switches to read-only mode, it will not recover automatically. You will have to manually reset this setting in the API.
MS from Tallahassee, FL wrote on Jan 10th, 2025:
Thanks a lot. This somewhat older post got me where I needed to go with ES 6.5 on a system with wildly unpredictable storage usage.

AI AWS Android Ansible Apache Apple Atlassian BSD Backup Bash Bluecoat CMS Chef Cloud Coding Consul Containers CouchDB DB DNS Databases Docker ELK Elasticsearch Filebeat FreeBSD Galera Git GlusterFS Grafana Graphics HAProxy HTML Hacks Hardware Icinga Influx Internet Java KVM Kibana Kodi Kubernetes LVM LXC Linux Logstash Mac Macintosh Mail MariaDB Minio MongoDB Monitoring Multimedia MySQL NFS Nagios Network Nginx OSSEC OTRS Observability Office OpenSearch PHP Perl Personal PostgreSQL PowerDNS Proxmox Proxy Python Rancher Rant Redis Roundcube SSL Samba Seafile Security Shell SmartOS Solaris Surveillance Systemd TLS Tomcat Ubuntu Unix VMware Varnish Virtualization Windows Wireless Wordpress Wyse ZFS Znuny Zoneminder