Sometimes you really need to dig deep to find the needle in the haystack. In the past three days we helped on solving an issue in an application API. The only hint we got from monitoring the API was that around every 90 minutes, the API's response time would spike up.

The first (obvious) assumption was that this could be caused by regular jobs within the application or triggered by a cron job or similar. But none of the kind were the cause. Over multiple hours we also closely monitored the API access requests - but no increased traffic or weird API calls were logged.
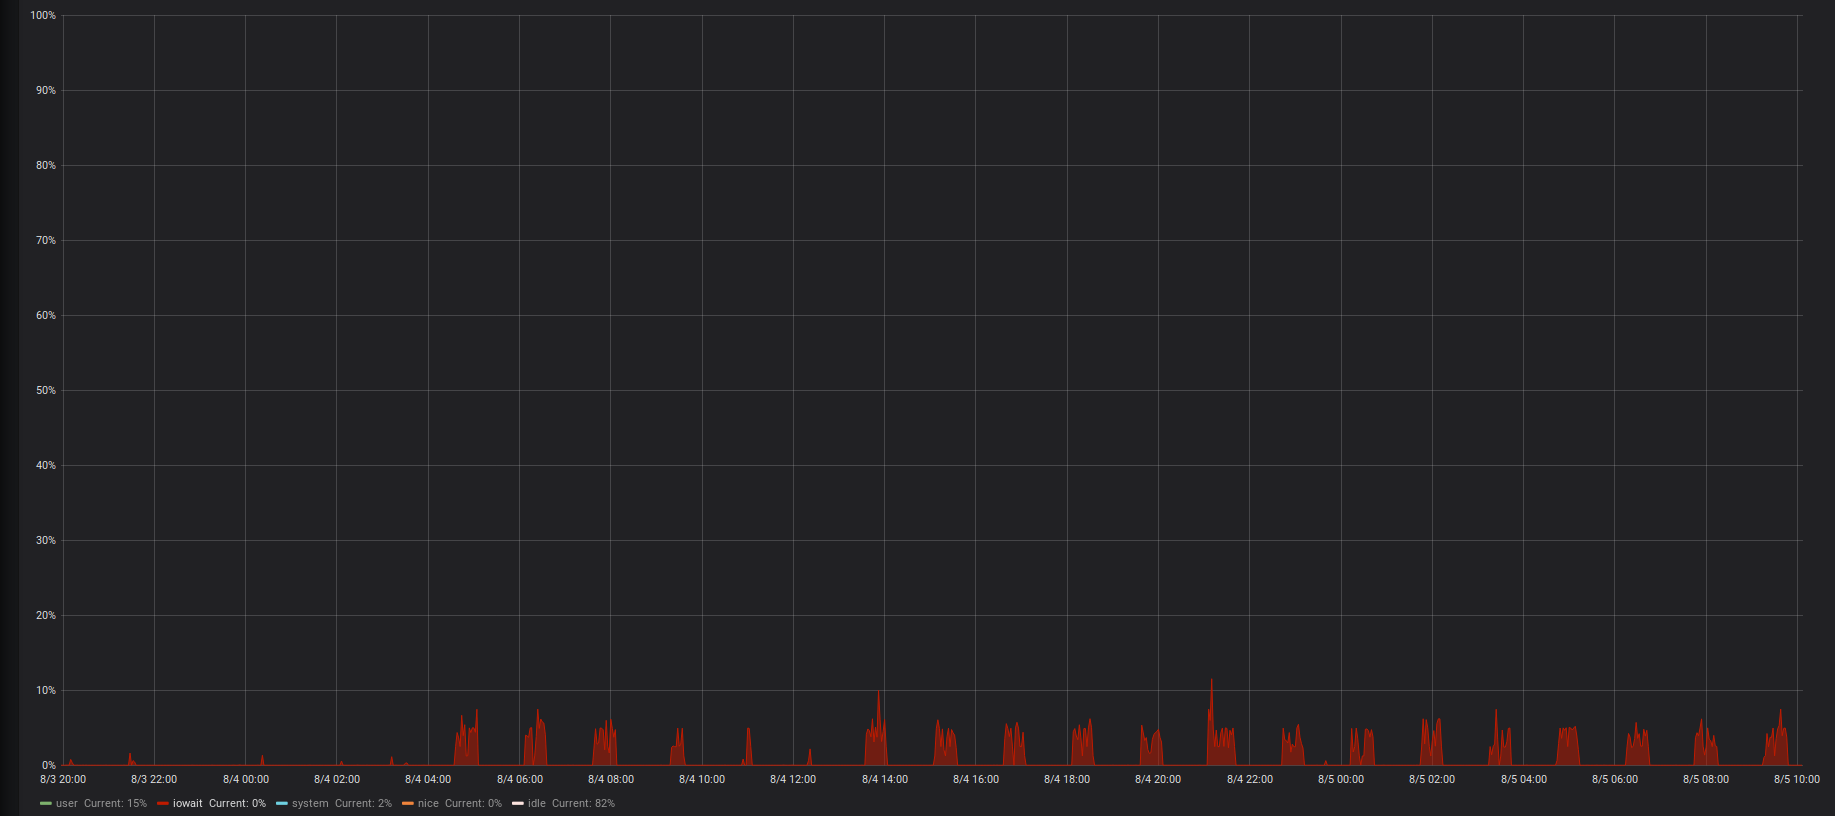
Finally we switched the focus to the secondary (standby) API node. This node is in sync with the primary node but does not receive API traffic; it just sits there IDLE in case of a failover. And this is where we noted the CPU spikes:
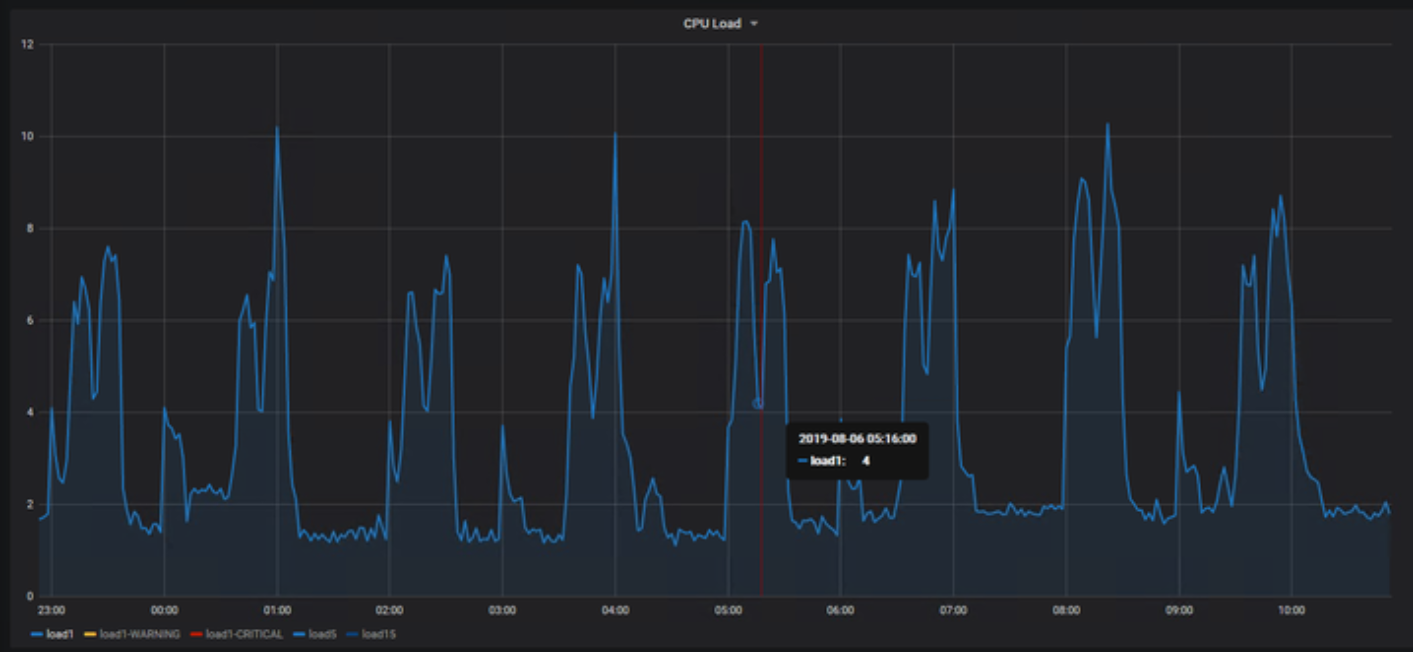
A closer look to the CPU stats revealed long periods of IOWAIT. Interestingly in ~90 minute intervals. Sounds familiar, right? And we also saw that these IOWAITs seemed to start since we noticed issues with the API.
Once logged in on this physical server (right during such a 30min high IOWAIT period), it became clear that something was not right. Some simple commands took a very long time to complete. For example listing the LVM's logical volumes took an extreme 18 seconds:
[root@server02 ~]# time lvs
LV VG Attr LSize Pool Origin Data% Meta% Move Log Cpy%Sync Convert
lv_opt vg_server02 -wi-ao---- 10,00g
lv_root vg_server02 -wi-ao---- 200,00g
lv_swap vg_server02 -wi-ao---- 16,00g
real 0m18.741s
user 0m0.003s
sys 0m0.006s
Compared to the primary server, where the same command finished much faster:
[root@server01 ~]# time lvs
LV VG Attr LSize Pool Origin Data% Meta% Move Log Cpy%Sync Convert
lv_opt vg_server01 -wi-ao---- 10,00g
lv_root vg_server01 -wi-ao---- 200,00g
lv_swap vg_server01 -wi-ao---- 16,00g
real 0m0.042s
user 0m0.006s
sys 0m0.001s
Dmesg revealed that a couple of "Kernel hung" events were logged:
INFO: task c1_cred:27410 blocked for more than 120 seconds.
Not tainted 2.6.32-754.10.1.el6.x86_64 #1
"echo 0 > /proc/sys/kernel/hung_task_timeout_secs" disables this message.
c1_cred D 0000000000000001 0 27410 18151 0x00000080
ffff88101cdabd98 0000000000000086 0000000000000000 ffff88101cdabdc8
ffff88101cdabe40 0000000000000001 000005eb68734899 ffff88101cdabdb8
00000001005ed093 000000000000279c ffff881026047ad8 ffff88101cdabfd8
Call Trace:
[
[
[
[
[
[
[
[
[
[
[
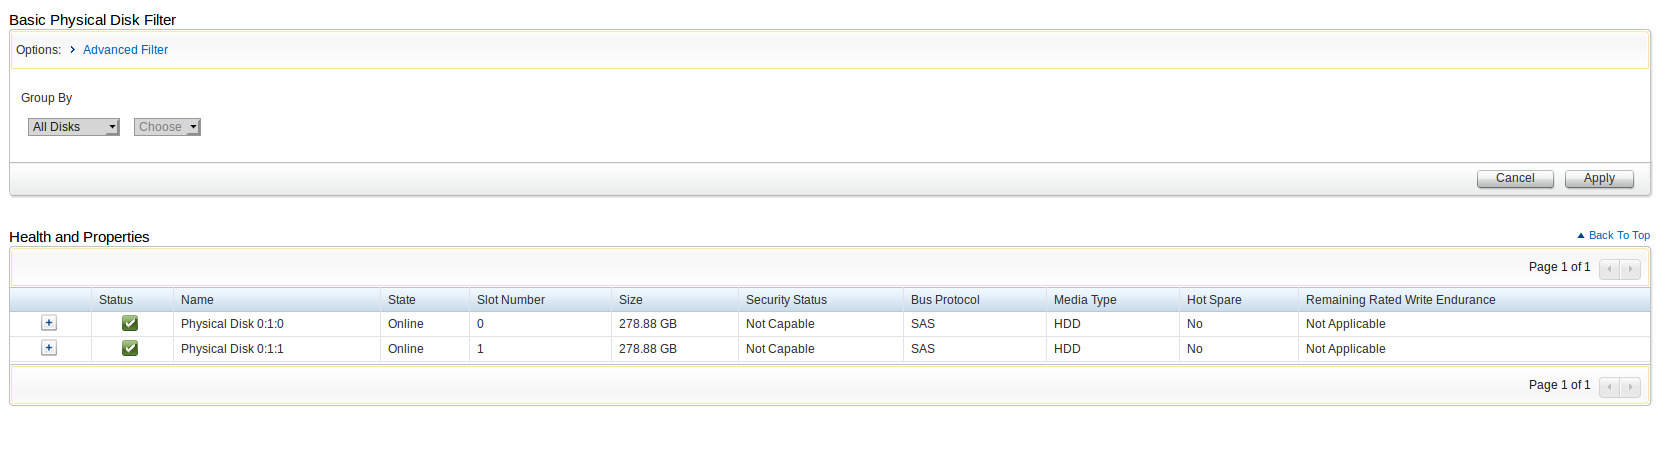
From this point on we could not rule out a hardware failure of that particular server, but according to the hardware status of the iDRAC card, everything seemed to be normal:
However, by reading the drive's SMART table with the check_smart monitoring plugin, something interesting was revealed:
[root@server02 ~]# /usr/lib/nagios/plugins/check_smart.pl -i megaraid,0 -d /dev/sda
CRITICAL: Disk temperature is higher than maximum|sent_blocks=1974874228 temperature=100;;68
The drive was at a cooking 100 degrees Celsius (= 212 degrees Fahrenheit)! Compared to this heat, the second drive of the RAID-1 array was at a chilling 30 degrees.
[root@server02 ~]# /usr/lib/nagios/plugins/check_smart.pl -i megaraid,1 -d /dev/sda
OK: no SMART errors detected. |sent_blocks=1830397621 temperature=30;;68
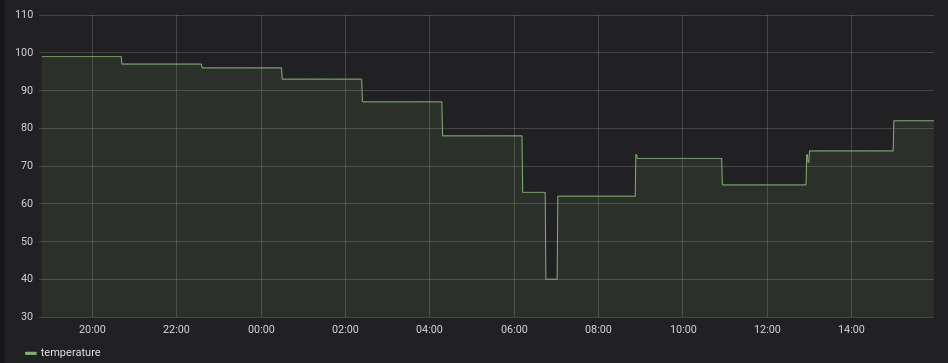
Now the second value (68) indicates the critical temperature when drives stop being operational or reliable. This value is set by the drive vendor. 100 degrees is clearly way above the threshold. I added additional monitoring and graphed the temperature using Icinga 2, Influx and Grafana. Once we stopped the application on that server (and therefore decreasing disk access) the temperature slowly decreased (but then increased again). But still now, while waiting for the replacement drive, and powered on but idle for the last 20 hours, the degrees is again at 81 degrees:
[root@server02 ~]# smartctl -d megaraid,0 -a /dev/sda
smartctl 5.43 2016-09-28 r4347 [x86_64-linux-2.6.32-754.10.1.el6.x86_64] (local build)
Copyright (C) 2002-12 by Bruce Allen, http://smartmontools.sourceforge.net
Vendor: SEAGATE
Product: ST9300653SS
Revision: YS0A
User Capacity: 300.000.000.000 bytes [300 GB]
Logical block size: 512 bytes
Logical Unit id: 0x5000c50076f80dc7
Serial number: XXXXXXXX
Device type: disk
Transport protocol: SAS
Local Time is: Wed Aug 7 14:45:02 2019 CEST
Device supports SMART and is Enabled
Temperature Warning Disabled or Not Supported
SMART Health Status: OK
Current Drive Temperature: 81 C
Drive Trip Temperature: 68 C
Manufactured in week 28 of year 2014
Specified cycle count over device lifetime: 10000
Accumulated start-stop cycles: 47
Elements in grown defect list: 0
Vendor (Seagate) cache information
Blocks sent to initiator = 1975376908
Blocks received from initiator = 20663588
Blocks read from cache and sent to initiator = 197566454
Number of read and write commands whose size <= segment size = 211742236
Number of read and write commands whose size > segment size = 64
Vendor (Seagate/Hitachi) factory information
number of hours powered up = 43547,12
number of minutes until next internal SMART test = 60
Error counter log:
Errors Corrected by Total Correction Gigabytes Total
ECC rereads/ errors algorithm processed uncorrected
fast | delayed rewrites corrected invocations [10^9 bytes] errors
read: 3545575637 0 0 3545575637 0 5066,173 0
write: 0 0 1 1 1 195856,879 0
verify: 1103591886 2 0 1103591888 5 74753,575 1
Non-medium error count: 20
SMART Self-test log
Num Test Status segment LifeTime LBA_first_err [SK ASC ASQ]
Description number (hours)
# 1 Background long Completed 32 43539 - [- - -]
# 2 Background short Completed 32 26 - [- - -]
# 3 Reserved(7) Completed 32 25 - [- - -]
# 4 Background short Completed 32 24 - [- - -]
Long (extended) Self Test duration: 2052 seconds [34,2 minutes]
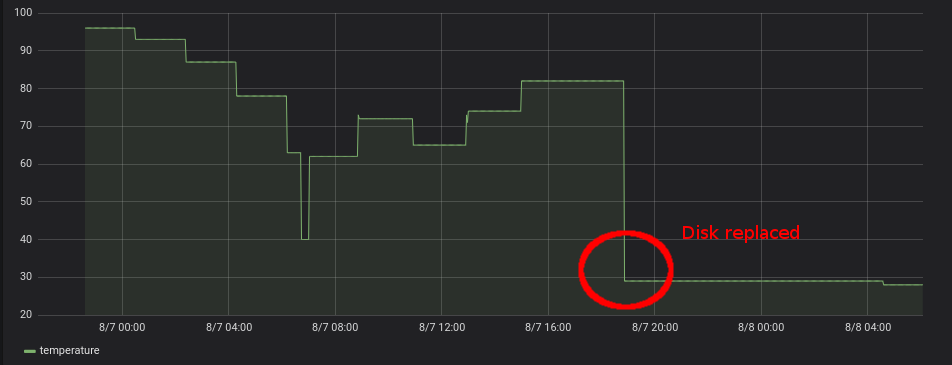
Once the drive was replaced you could see the temperature drop of the first drive:
The server was taken back into the API cluster, the API continued to run smoothly. The IOWAITs were gone. It was indeed the cooking hard drive which caused these high re-occurring API latencies.
Once again such a case shows that monitoring a single endpoint (in this case the Hardware using Dell iDrac) is never enough. Although, this was not an easy find and honestly nobody would have thought of a cooking hard drive as cause, a SMART disk monitoring from the beginning would have helped reduce the troubleshooting time.
No comments yet.

AI AWS Android Ansible Apache Apple Atlassian BSD Backup Bash Bluecoat CMS Chef Cloud Coding Consul Containers CouchDB DB DNS Databases Docker ELK Elasticsearch Filebeat FreeBSD Galera Git GlusterFS Grafana Graphics HAProxy HTML Hacks Hardware Icinga Influx Internet Java KVM Kibana Kodi Kubernetes LVM LXC Linux Logstash Mac Macintosh Mail MariaDB Minio MongoDB Monitoring Multimedia MySQL NFS Nagios Network Nginx OSSEC OTRS Observability Office OpenSearch PHP Perl Personal PostgreSQL PowerDNS Proxmox Proxy Python Rancher Rant Redis Roundcube SSL Samba Seafile Security Shell SmartOS Solaris Surveillance Systemd TLS Tomcat Ubuntu Unix VMware Varnish Virtualization Windows Wireless Wordpress Wyse ZFS Znuny Zoneminder