
Up until today the monitoring plugin check_smart, to monitor the SMART table of hard and solid state drives, simply returned the current status of a drive:
root@awesome ~ # /usr/lib/nagios/plugins/check_smart.pl -d /dev/sda -i ata
OK: no SMART errors detected. |Raw_Read_Error_Rate=0 Spin_Up_Time=3366 Start_Stop_Count=38 Reallocated_Sector_Ct=0 Seek_Error_Rate=0 Power_On_Hours=22483 Spin_Retry_Count=0 Calibration_Retry_Count=0 Power_Cycle_Count=38 Power-Off_Retract_Count=26 Load_Cycle_Count=249401 Temperature_Celsius=36 Reallocated_Event_Count=0 Current_Pending_Sector=0 Offline_Uncorrectable=0 UDMA_CRC_Error_Count=0 Multi_Zone_Error_Rate=0
This output is usually helpful enough as long as using directly attached drives and fixed drive orders. But what about dynamic drive assigning and hardware raid controllers? Depending on the connected ATA port or the number of drives attached to a controller, the order might change. See the following example on a HP Proliant server:
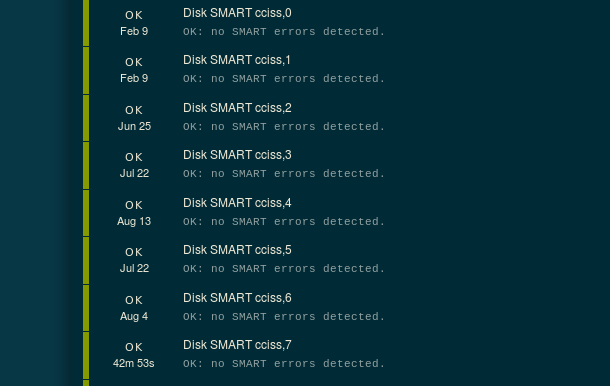
In this case seen in the screenshot above, 8 physical hard drives are attached to a P410i and accessed with the CCISS driver. However if one drive gets removed, the order within the raid controller might change. This forcibly needs to manual analysis, to find out which exact drive is showing an error.
In the new version 6.2 the output of the plugin was adjusted to contain the drive's model and serial number:
root@awesome ~ # /usr/lib/nagios/plugins/check_smart.pl -d /dev/sda -i ata
OK: Drive WDC WD5000AZRZ-00HTKB0 S/N WD-XXXXXXXXXXXX: no SMART errors detected. |Raw_Read_Error_Rate=0 Spin_Up_Time=3366 Start_Stop_Count=38 Reallocated_Sector_Ct=0 Seek_Error_Rate=0 Power_On_Hours=22484 Spin_Retry_Count=0 Calibration_Retry_Count=0 Power_Cycle_Count=38 Power-Off_Retract_Count=26 Load_Cycle_Count=249401 Temperature_Celsius=36 Reallocated_Event_Count=0 Current_Pending_Sector=0 Offline_Uncorrectable=0 UDMA_CRC_Error_Count=0 Multi_Zone_Error_Rate=0
This should help the administrator to quickly identify the failing drive without additional analysis on the server.
Especially on server with a lot of drives, this will be very helpful. To see the same drive overview from the HP server again:
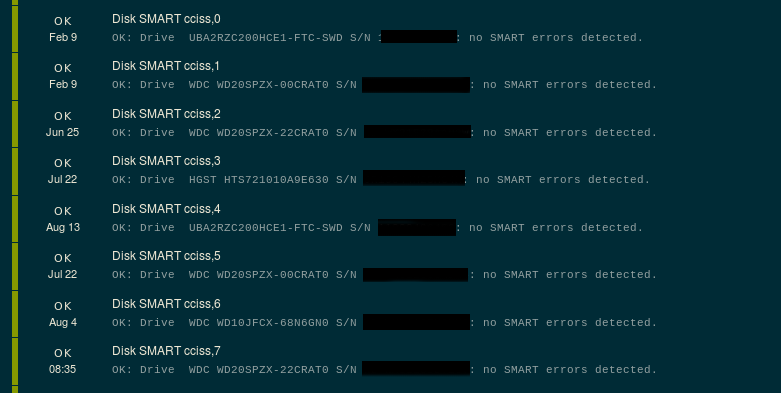
Note: This additional information is only shown when using a single drive check using the -d parameter. This does not work when the plugin was used with the -g parameter!
No comments yet.

AI AWS Android Ansible Apache Apple Atlassian BSD Backup Bash Bluecoat CMS Chef Cloud Coding Consul Containers CouchDB DB DNS Databases Docker ELK Elasticsearch Filebeat FreeBSD Galera Git GlusterFS Grafana Graphics HAProxy HTML Hacks Hardware Icinga Influx Internet Java KVM Kibana Kodi Kubernetes LVM LXC Linux Logstash Mac Macintosh Mail MariaDB Minio MongoDB Monitoring Multimedia MySQL NFS Nagios Network Nginx OSSEC OTRS Observability Office OpenSearch PHP Perl Personal PostgreSQL PowerDNS Proxmox Proxy Python Rancher Rant Redis Roundcube SSL Samba Seafile Security Shell SmartOS Solaris Surveillance Systemd TLS Tomcat Ubuntu Unix VMware Varnish Virtualization Windows Wireless Wordpress Wyse ZFS Znuny Zoneminder