
If you are using Rancher 2 to manage HA Kubernetes clusters, you've most likely already seen these errors on the cluster overview in the Rancher user interface:
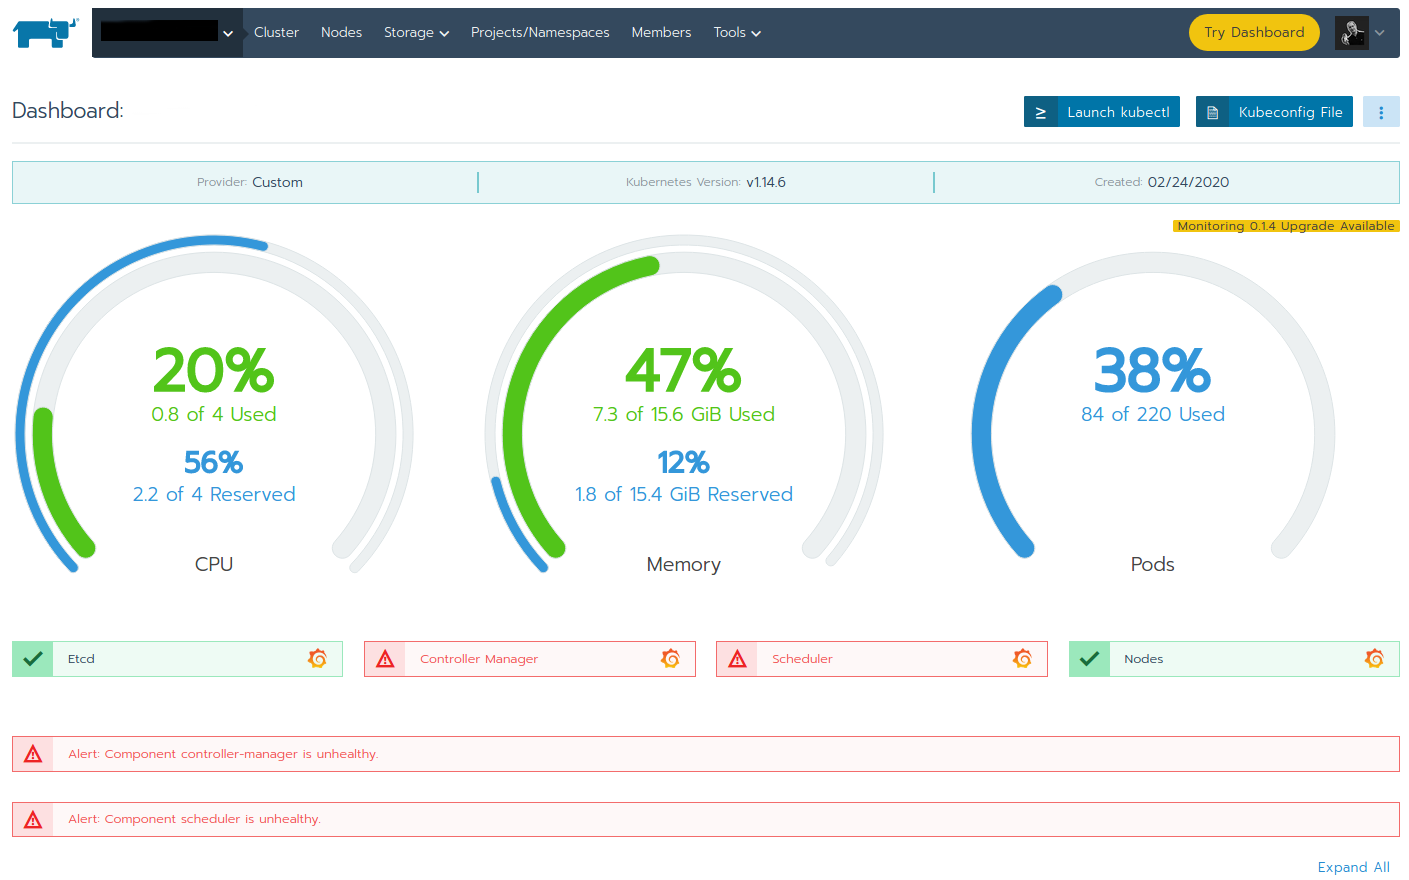
A combination of red colour and mentioning "Alert" should immediately trigger every senses of every administrator and engineer: That can't be good!
But these errors actually turns out to be a false positive (mostly anyway) and can safely be ignored (most of the times). But why is that? Let's dig deeper in this 3-node HA Kubernetes cluster, where node 1 and 2 have "All" roles assigned and node 3 only runs with roles "etcd" and "controlplane" assigned.
The Rancher application (including the UI) uses its own Rancher API to query the status of these components. The following cluster components are checked:
The monitoring plugin check_rancher2 (a monitoring plugin especially created to monitor Kubernetes clusters managed by Rancher 2) does the same when checking the health of clusters:
$ ./check_rancher2.sh -H rancher2.example.com -U token-xxxxx -P secret -S -t cluster
CHECK_RANCHER2 CRITICAL - controller-manager in cluster mycluster1 is not healthy - scheduler in cluster mycluster1 is not healthy -|'clusters_total'=5;;;; 'clusters_errors'=1;;;;
The Rancher 2 API retrieves the component statuses from the Kubernetes API, which can be verified manually using kubectl.
Once kubectl is configured to talk to the Rancher managed Kubernetes cluster (see How to use kubectl on a Rancher 2 managed Kubernetes cluster), the ComponentStatus (short cs) can be retrieved from the Kubernetes API:
$ kubectl get ComponentStatus
NAME STATUS MESSAGE
controller-manager Unhealthy Get http://127.0.0.1:10252/healthz: dial tcp 127.0.0.1:10252: connect: connection refused
scheduler Unhealthy Get http://127.0.0.1:10251/healthz: dial tcp 127.0.0.1:10251: connect: connection refused
etcd-0 Healthy {"health":"true"}
etcd-2 Healthy {"health":"true"}
etcd-1 Healthy {"health":"true"}
That's the same information as shown in Rancher's user interface and in check_rancher2. The message shows that an attempted HTTP request failed. Let's do this on all three cluster nodes:
root@node1:~# curl http://127.0.0.1:10251/healthz
curl: (7) Failed to connect to 127.0.0.1 port 10251: Connection refused
root@node2:~# curl http://127.0.0.1:10251/healthz
curl: (7) Failed to connect to 127.0.0.1 port 10251: Connection refused
root@node3:~# curl http://127.0.0.1:10251/healthz
ok
Note: Ports 10251 and 10252 are insecure http ports. The secure https alternatives are ports 10257 and 10259. See Kubernetes issue #1327.
Interesting! The third node was able to run this health check with success! What is different on this node 3 than on nodes 1 and 2?
It turns out, that this node 3 is running the controller-manager and scheduler!
root@node1:~# netstat -lntup | egrep "(10251|10252)"
root@node1:~#
root@node2:~# netstat -lntup | egrep "(10251|10252)"
root@node2:~#
root@node3:~# netstat -lntup | egrep "(10251|10252)"
tcp6 0 0 :::10251 :::* LISTEN 29933/kube-schedule
tcp6 0 0 :::10252 :::* LISTEN 30029/kube-controll
Another way to find out on which node these components are running is to use kubectl:
$ kubectl -n kube-system describe endpoints kube-controller-manager
Name: kube-controller-manager
Namespace: kube-system
Labels: <none>
Annotations: control-plane.alpha.kubernetes.io/leader:
{"holderIdentity":"node3_5985cd1e-6967-11eb-8aac-027a1a932b10","leaseDurationSeconds":15,"acquireTime":"2021-02-07T17...
Subsets:
Events: <none>
$ kubectl -n kube-system describe endpoints kube-scheduler
Name: kube-scheduler
Namespace: kube-system
Labels: <none>
Annotations: control-plane.alpha.kubernetes.io/leader:
{"holderIdentity":"node3_59623573-6967-11eb-8f86-027a1a932b10","leaseDurationSeconds":15,"acquireTime":"2021-02-07T17...
Subsets:
Events: <none>
The "holder" of these endpoints is in both cases our node 3.
However as both of these endpoints clearly seem to work (on node 3 at least), why is the Kubernetes API marking them unhealthy? For this we need to follow the rabbit further down into the hole.
The Kubernetes cluster architecture is built on the Kubernetes API, or short Kube-API. This API is of the same importance as etcd. If the API is gone, the cluster is gone. That's why the API is running on each cluster node (not worker nodes!). This can easily be seen using docker commands:
root@node1:~# docker ps | grep apiserver
CONTAINER ID IMAGE COMMAND CREATED STATUS NAMES
a229f5e9ae69 rancher/hyperkube:v1.14.6-rancher1 "/opt/rke-tools/entr…" 11 months ago Up 8 months kube-apiserver
root@node2:~# docker ps | grep apiserver
fb4b5ff3a7e2 rancher/hyperkube:v1.14.6-rancher1 "/opt/rke-tools/entr…" 11 months ago Up 8 months kube-apiserver
root@node3:~# docker ps | grep apiserver
ee9aa10d0215 rancher/hyperkube:v1.14.6-rancher1 "/opt/rke-tools/entr…" 11 months ago Up 8 months kube-apiserver
Each cluster node accepts communication requests (using HTTPS) on the Kubernetes API port 6443:
root@node1:~# netstat -lntup|grep 6443
tcp6 0 0 :::6443 :::* LISTEN 880/kube-apiserver
root@node2:~# netstat -lntup|grep 6443
tcp6 0 0 :::6443 :::* LISTEN 880/kube-apiserver
root@node3:~# netstat -lntup|grep 6443
tcp6 0 0 :::6443 :::* LISTEN 880/kube-apiserver
To ensure an always available API, a static internal IP is used within the Kubernetes cluster: 10.43.0.1 (source).
This IP is therefore the internal access IP for everything accessing the Kubernetes API. However how is this IP actually configured? Especially when it is static? There is a hidden man in the middle doing some magic: iptables!
Taking a closer look at the firewall forwarding rules using iptables, the following relevant entries can be found (they look the same on all cluster nodes):
root@node1:~# iptables -t nat -nvL
[...]
Chain PREROUTING (policy ACCEPT 12 packets, 744 bytes)
pkts bytes target prot opt in out source destination
62M 4053M cali-PREROUTING all -- * * 0.0.0.0/0 0.0.0.0/0 /* cali:6gwbT8clXdHdC1b1 */
62M 4053M KUBE-SERVICES all -- * * 0.0.0.0/0 0.0.0.0/0 /* kubernetes service portals */
60M 3877M DOCKER all -- * * 0.0.0.0/0 0.0.0.0/0 ADDRTYPE match dst-type LOCAL
[...]
The PREROUTING chain (used typically for DNAT rules), refers to an internal chain called "KUBE-SERVICES":
[...]
Chain KUBE-SERVICES (2 references)
pkts bytes target prot opt in out source destination
0 0 KUBE-MARK-MASQ tcp -- * * !10.42.0.0/16 10.43.0.1 /* default/kubernetes:https cluster IP */ tcp dpt:443
0 0 KUBE-SVC-NPX46M4PTMTKRN6Y tcp -- * * 0.0.0.0/0 10.43.0.1 /* default/kubernetes:https cluster IP */ tcp dpt:443
[...]
This chain KUBE-SERVICES contains multiple port forwardings. The relevant ones for the API are the rules with destination to 10.43.0.1.
There are actually two rules which match a destination 10.43.0.1:
The first rule matches external requests (from outside the Kubernetes cluster). This is handled by doing a negated rule and can be understood as "if request is NOT coming from the 10.42.0.0/16 range". Nothing big happens in this situation; the packets are simply marked as masqueraded and then land on the node and then lands on the kube-apiserver listener. This typically happens when requests are arriving on the node's own IP address.
But if the second rule is matched (therefore requests coming from within the Kubernetes cluster), yet another chain is called: KUBE-SVC-NPX46M4PTMTKRN6Y.
This chain KUBE-SVC-NPX46M4PTMTKRN6Y is very interesting as it contains a special iptables loadbalancing (nicely explained here) ruleset.
There are three rules in this chain. The first rule contains an appended "statistic mode random probability 0.33332999982". This means that every third request (33%) is handled by this rule and will be forwarded to chain KUBE-SEP-JI2YDTPJGKQ65QZ6. All others (67%) skip this rule and go on to the second rule in the chain.
The second rule has itself yet another load balancing probability of 50% defined. Meaning: 50% of all packets arriving to this rule (which is 67% of all requests) will be handled by the rule and forwarded to chain KUBE-SEP-QHIGH2IZY5DN2JMY. The other 50% are skipped and move on to the third and last rule in the chain.
The third rule doesn't contain any load balancing probability setting anymore. This means that this rule will not skip any incoming packets and will forward them to chain KUBE-SEP-QROB4HJUVU2OVFPU.
[...]
Chain KUBE-SVC-NPX46M4PTMTKRN6Y (1 references)
pkts bytes target prot opt in out source destination
0 0 KUBE-SEP-JI2YDTPJGKQ65QZ6 all -- * * 0.0.0.0/0 0.0.0.0/0 statistic mode random probability 0.33332999982
0 0 KUBE-SEP-QHIGH2IZY5DN2JMY all -- * * 0.0.0.0/0 0.0.0.0/0 statistic mode random probability 0.50000000000
0 0 KUBE-SEP-QROB4HJUVU2OVFPU all -- * * 0.0.0.0/0 0.0.0.0/0
[...]
Looking closer at these three destination chains should not surprise anyone:
[...]
Chain KUBE-SEP-JI2YDTPJGKQ65QZ6 (1 references)
pkts bytes target prot opt in out source destination
0 0 KUBE-MARK-MASQ all -- * * 10.10.1.144 0.0.0.0/0
0 0 DNAT tcp -- * * 0.0.0.0/0 0.0.0.0/0 tcp to:10.10.1.144:6443
[...]
Chain KUBE-SEP-QHIGH2IZY5DN2JMY (1 references)
pkts bytes target prot opt in out source destination
0 0 KUBE-MARK-MASQ all -- * * 10.150.79.150 0.0.0.0/0
0 0 DNAT tcp -- * * 0.0.0.0/0 0.0.0.0/0 tcp to:10.150.79.150:6443
[...]
Chain KUBE-SEP-QROB4HJUVU2OVFPU (1 references)
pkts bytes target prot opt in out source destination
0 0 KUBE-MARK-MASQ all -- * * 10.150.79.151 0.0.0.0/0
0 0 DNAT tcp -- * * 0.0.0.0/0 0.0.0.0/0 tcp to:10.150.79.151:6443
Yep - these are the internal IPs of cluster nodes node3, node1 and node2 (from top to bottom).
Following that logic of the iptables loadbalancer should therefore also change the reported health state by the Kubernetes API: It should work at least every third time, whenever the API request lands on the kube-apiserver on node3. Right?
So much to the theory but there is another fact to comprehend:
Note that the load balancing will only be done during the connection phase of the TCP protocol. Once the connection has been established, the connection will always be routed to the same server.
This could potentially mean that the cluster requests to the API always land on the same node. This would certainly explain this situation with the returned component status failing.
A tcpdump (looking for SYN packets on port 6443 only) on all three nodes revealed that whenever the Rancher UI on this cluster was refreshed or kubectl was launched against this particular cluster, there was a new connection established from node3 10.10.1.144 (where controller-manager and scheduler is running) to node2 10.150.79.151:
root@node3:~# tcpdump -nn -i ens5 port 6443 and "tcp[tcpflags] & (tcp-syn) != 0"
tcpdump: verbose output suppressed, use -v or -vv for full protocol decode
listening on ens5, link-type EN10MB (Ethernet), capture size 262144 bytes
14:10:22.609821 IP 10.10.1.144.34518 > 10.150.79.151.6443: Flags [S], seq 2290622126, win 64240, options [mss 1460,sackOK,TS val 1058369865 ecr 0,nop,wscale 7], length 0
14:10:22.619957 IP 10.150.79.151.6443 > 10.10.1.144.34518: Flags [S.], seq 2992907365, ack 2290622127, win 65160, options [mss 1375,sackOK,TS val 3555511202 ecr 1058369865,nop,wscale 7], length 0
14:10:45.769437 IP 10.10.1.144.34584 > 10.150.79.151.6443: Flags [S], seq 1539669371, win 64240, options [mss 1460,sackOK,TS val 1058393024 ecr 0,nop,wscale 7], length 0
14:10:45.779922 IP 10.150.79.151.6443 > 10.10.1.144.34584: Flags [S.], seq 1764445111, ack 1539669372, win 65160, options [mss 1375,sackOK,TS val 3555534361 ecr 1058393024,nop,wscale 7], length 0
14:10:45.866711 IP 10.10.1.144.34586 > 10.150.79.151.6443: Flags [S], seq 4247177279, win 64240, options [mss 1460,sackOK,TS val 1058393121 ecr 0,nop,wscale 7], length 0
14:10:45.876613 IP 10.150.79.151.6443 > 10.10.1.144.34586: Flags [S.], seq 497454553, ack 4247177280, win 65160, options [mss 1375,sackOK,TS val 3555534458 ecr 1058393121,nop,wscale 7], length 0
root@node2:~# tcpdump -nn -i ens192 port 6443 and "tcp[tcpflags] & (tcp-syn) != 0"
tcpdump: verbose output suppressed, use -v or -vv for full protocol decode
listening on ens192, link-type EN10MB (Ethernet), capture size 262144 bytes
14:10:21.496278 IP 10.10.1.144.34518 > 10.150.79.151.6443: Flags [S], seq 2290622126, win 64240, options [mss 1375,sackOK,TS val 1058369865 ecr 0,nop,wscale 7], length 0
14:10:21.496326 IP 10.150.79.151.6443 > 10.10.1.144.34518: Flags [S.], seq 2992907365, ack 2290622127, win 65160, options [mss 1460,sackOK,TS val 3555511202 ecr 1058369865,nop,wscale 7], length 0
14:10:44.655539 IP 10.10.1.144.34584 > 10.150.79.151.6443: Flags [S], seq 1539669371, win 64240, options [mss 1375,sackOK,TS val 1058393024 ecr 0,nop,wscale 7], length 0
14:10:44.655589 IP 10.150.79.151.6443 > 10.10.1.144.34584: Flags [S.], seq 1764445111, ack 1539669372, win 65160, options [mss 1460,sackOK,TS val 3555534361 ecr 1058393024,nop,wscale 7], length 0
14:10:44.752265 IP 10.10.1.144.34586 > 10.150.79.151.6443: Flags [S], seq 4247177279, win 64240, options [mss 1375,sackOK,TS val 1058393121 ecr 0,nop,wscale 7], length 0
14:10:44.752375 IP 10.150.79.151.6443 > 10.10.1.144.34586: Flags [S.], seq 497454553, ack 4247177280, win 65160, options [mss 1460,sackOK,TS val 3555534458 ecr 1058393121,nop,wscale 7], length 0
Note: Yes, times differ ~1s between these two nodes.
tcpdump clearly reveals that node3 initiates the communication with node2. Interestingly node1 never got any communication on port 6443 during these tests.
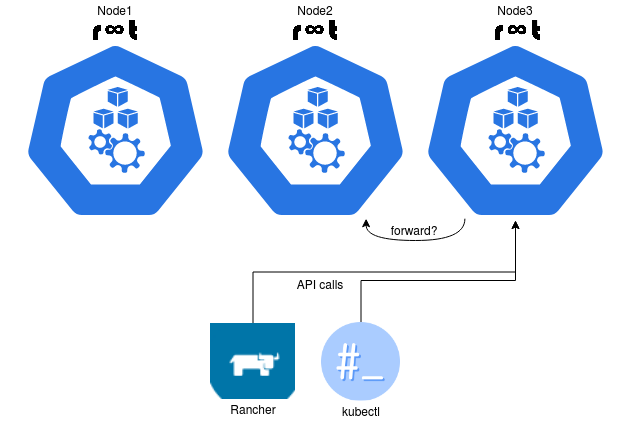
From the current perspective it looks as if requests from either Rancher 2 or kubectl land on node 3 (probably due to the fact that the controller-manager is currently running on this node) but are then forwarded to node 2. But pictures speak more than words:
Even during extensive research through documentation and issues, no information could be found whether the Kubernetes API is running (by default) on a particular node in "master node" (kind of as controller-manager and scheduler are doing it). However if the source of the problem is really the Kubernetes API and where it runs, simply kill the kube-apiserver containers on nodes 1 and 2, right?
The kube-apiserver containers were manually stopped on nodes 1 and 2:
root@node1:~# docker ps -a|grep apiserver
a229f5e9ae69 rancher/hyperkube:v1.14.6-rancher1 "/opt/rke-tools/entr…" 11 months ago Up 8 months kube-apiserver
root@node1:~# docker stop a229f5e9ae69
a229f5e9ae69
root@node1:~# docker ps -a|grep apiserver
a229f5e9ae69 rancher/hyperkube:v1.14.6-rancher1 "/opt/rke-tools/entr…" 11 months ago Exited (0) 35 seconds ago ube-apiserver
root@node2:~# docker ps -a|grep apiserver
fb4b5ff3a7e2 rancher/hyperkube:v1.14.6-rancher1 "/opt/rke-tools/entr…" 11 months ago Up 8 months kube-apiserver
root@node2:~# docker stop fb4b5ff3a7e2
fb4b5ff3a7e2
root@node2:~# docker ps -a|grep apiserver
fb4b5ff3a7e2 rancher/hyperkube:v1.14.6-rancher1 "/opt/rke-tools/entr…" 11 months ago Exited (0) 30 seconds ago kube-apiserver
What happened then caught by us surprise, even though we were hoping to confirm our theory: The API was not accessible anymore!
kubectl was unable to talk to the cluster anymore:
$ kubectl get cs
Error from server (ServiceUnavailable): the server is currently unable to handle the request
In Rancher UI the cluster was showing up as unavailable:
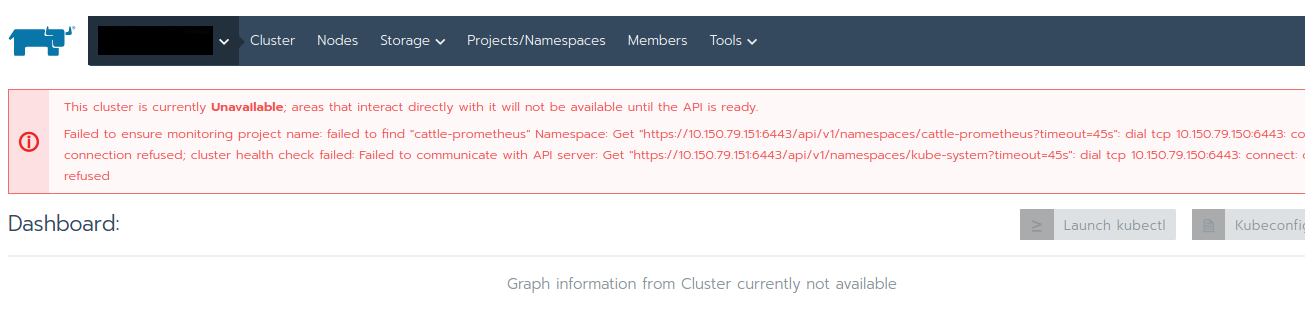
Alerts were popping up, that the cluster communication failed:
Error
Get "https://10.150.79.151:6443/api/v1/namespaces?timeout=45s": dial tcp 10.150.79.151:6443: connect: connection refused
OK the cluster was gone in this moment - but this was exactly what we wanted to find out. Obviously all cluster communication happened on a fixed API endpoint, on node 2 (10.150.79.151)!
After around one minute, the cluster became available again, however with nodes 1 and 2 marked as unavailable. But the most interesting part: The health checks for controller-manager and scheduler became green!
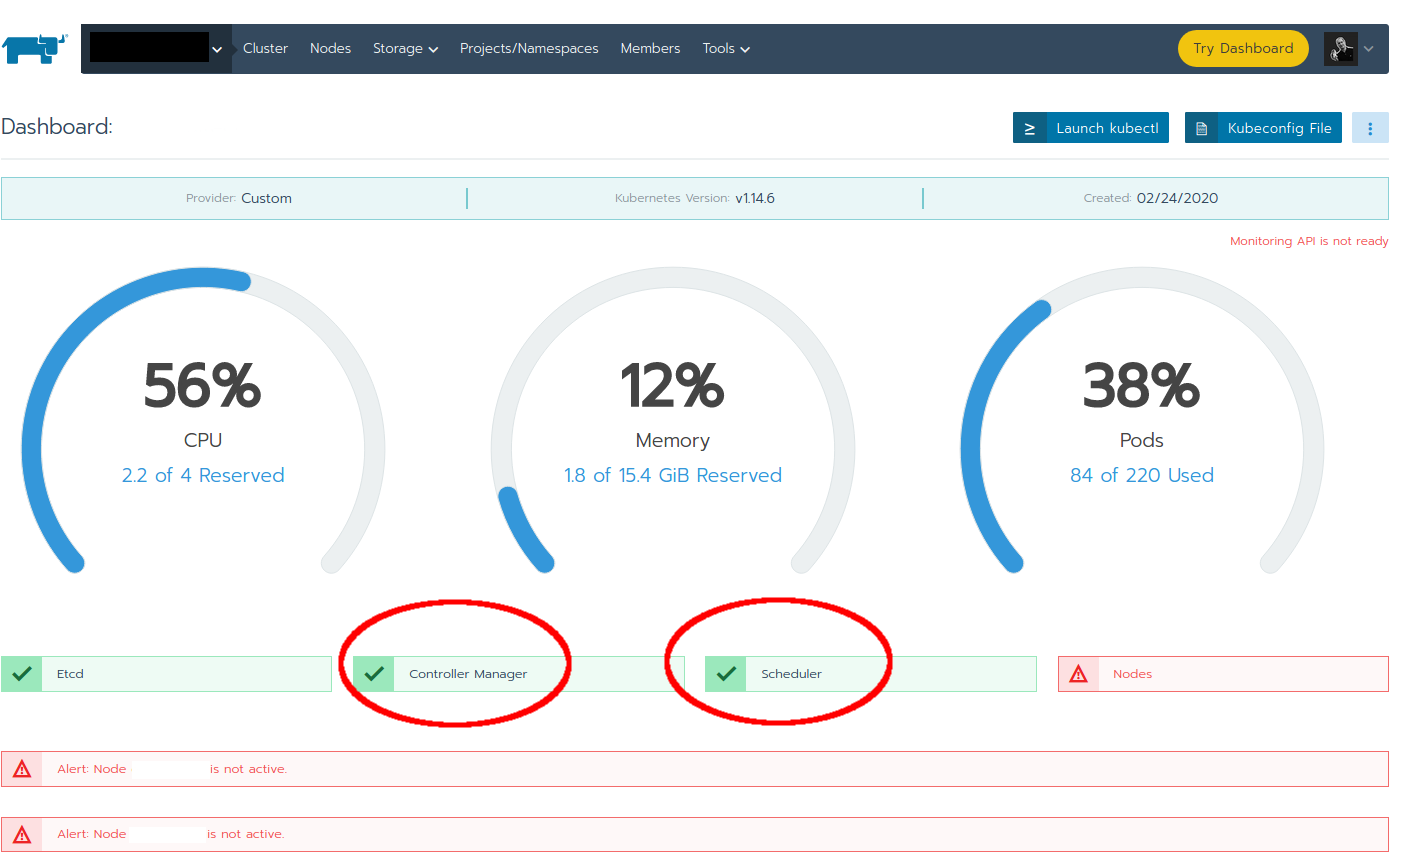
Also kubectl started to work again and the ComponentStatus could be checked again:
$ kubectl get cs
NAME STATUS MESSAGE ERROR
controller-manager Healthy ok
scheduler Healthy ok
etcd-0 Healthy {"health":"true"}
etcd-1 Healthy {"health":"true"}
etcd-2 Healthy {"health":"true"}
All is healthy now! Wow... just wow.
As soon as kube-apiserver containers were started on nodes 1 and 2 again, the API endpoint seemed to switch again to either one of nodes 1 or 2 and the health checks turned red again. Frustrating!
Quite obviously the ComponentStatus health checks of controller-manager and scheduler are something in Kubernetes which are not working as they should. Whether or not they appear as healthy or unhealthy depends where (on which node) the API request is currently executed. If this happens on the same node where controller-manager and scheduler are running, the health check will return healthy. If this happens on any other cluster node, the health checks will fail and return unhealthy.
Is this a known Kubernetes problem? Yes (link 1, link 2, link 3, ...)
Can this be solved? Probably - all it needs is another iptables chain which forwards these specific check ports from localhost to the relevant node.
Will it be solved? No. im
Erm, what?! You read right, this won't be solved. These so-called "componentstatus" are marked as deprecated as of Kubernetes 1.19 (see issues #553 and PR #93570).
The big question will now be how will the controller-manager and scheduler services be monitored in the future? This question unfortunately remains unanswered and is also discussed in Rancher's repository (see issue #11496). Depending on how this is implemented on Rancher's side, will also affect the check_rancher2 monitoring plugin.
For now there are a couple of important points to remember:
Updated: June 2nd, 2021
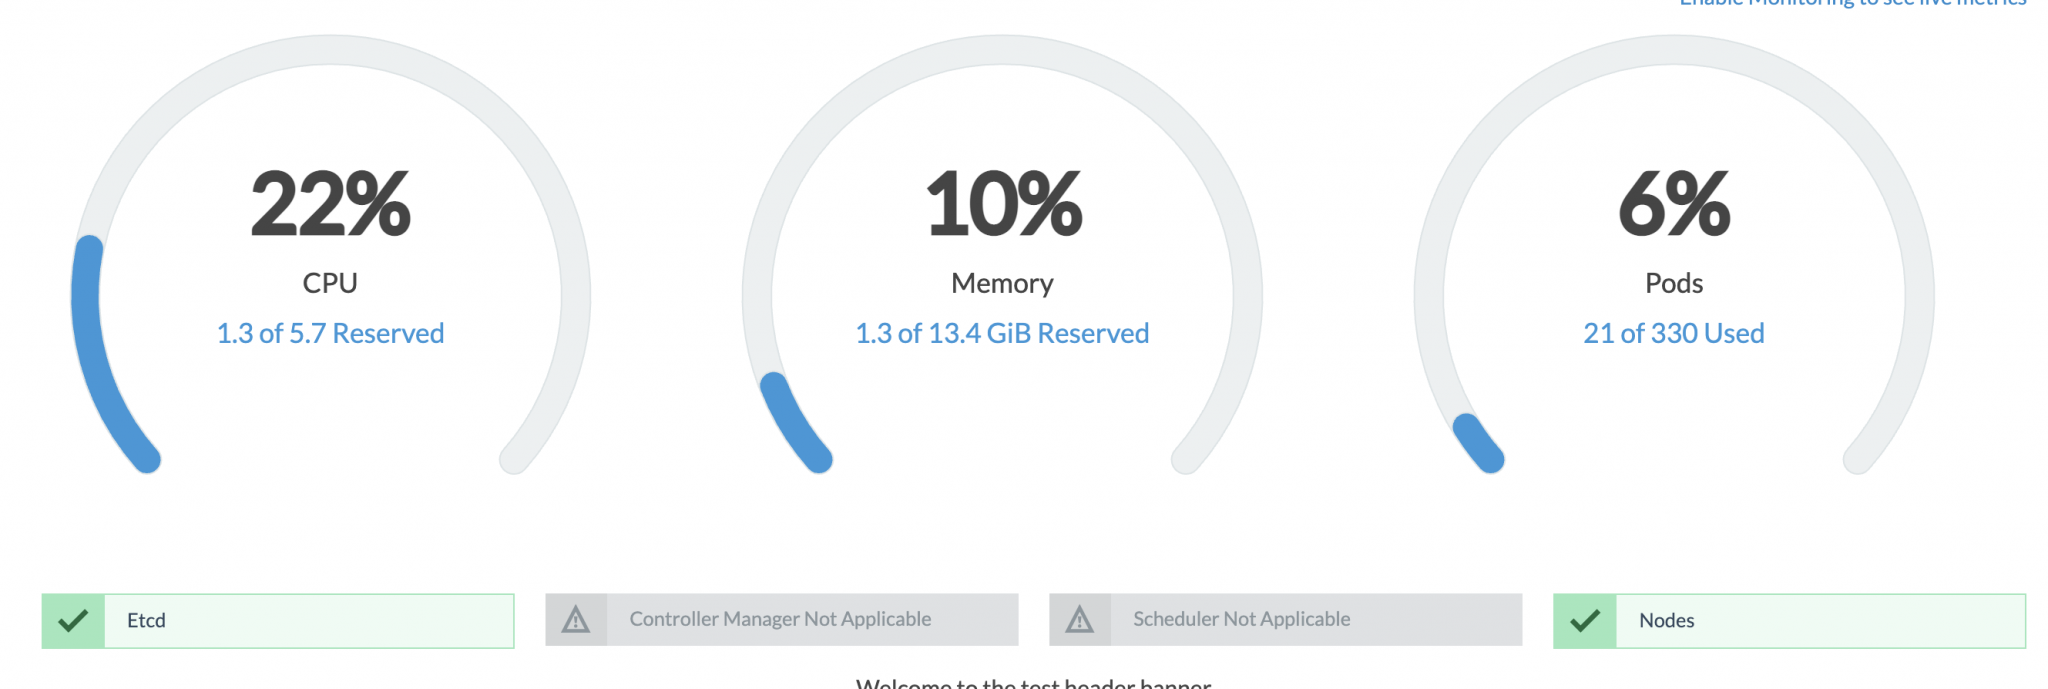
The mentioned issue #11496) was closed today with the following solution: The Rancher UI will show "Controller Manager Not Applicable" and "Scheduler Not Applicable":
The exact Rancher 2.x release where this will be shown is unknown at this time. It's likely to be included in the next 2.5 release which would be 2.5.9.
Updated: August 26th, 2021
Rancher 2.5.9 was released but does not yet contain the fix. According to this comment, the fix should be in 2.5.10.
No comments yet.

AI AWS Android Ansible Apache Apple Atlassian BSD Backup Bash Bluecoat CMS Chef Cloud Coding Consul Containers CouchDB DB DNS Databases Docker ELK Elasticsearch Filebeat FreeBSD Galera Git GlusterFS Grafana Graphics HAProxy HTML Hacks Hardware Icinga Influx Internet Java KVM Kibana Kodi Kubernetes LVM LXC Linux Logstash Mac Macintosh Mail MariaDB Minio MongoDB Monitoring Multimedia MySQL NFS Nagios Network Nginx OSSEC OTRS Observability Office OpenSearch PHP Perl Personal PostgreSQL PowerDNS Proxmox Proxy Python Rancher Rant Redis Roundcube SSL Samba Seafile Security Shell SmartOS Solaris Surveillance Systemd TLS Tomcat Ubuntu Unix VMware Varnish Virtualization Windows Wireless Wordpress Wyse ZFS Znuny Zoneminder