
A few months ago I wrote about "Automatic SLA reporting from Icinga and push into Confluence page". Since then the script runs on every 1st of the month and automatically updates the relevant pages in our Confluence Wiki. So far so good but sometimes I came across some problems in the calculation of last months availability. On some occasions the json format contained a number too big to handle for json (see step #4 in the article mentioned) and I turned to the CSV output as an alternative.
Yesterday I added the possibility to retrieve the availability stats for a service group (instead of a fixed host and a service of the host). The problem: The CSV output does not contain the average stats of the service group, only the single stats of each service of the group!
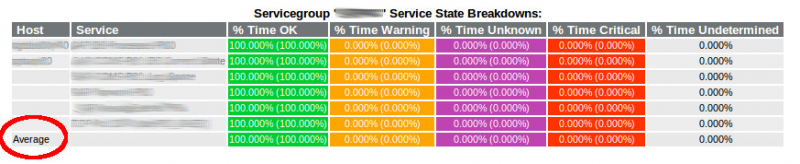
The HTML output shows as last row the average numbers of all services:
Now comparing with the full CSV output of the same availablity report:
'SERVICEGROUP GROUPNAME HOST_STATE_BREAKDOWNS';
'host_name';'time_up_scheduled';'percent_time_up_scheduled';'percent_known_time_up_scheduled';'time_up_unscheduled';'percent_time_up_unscheduled';'percent_known_time_up_unscheduled';'total_time_up';'percent_total_time_up';'percent_known_time_up';'time_down_scheduled';'percent_time_down_scheduled';'percent_known_time_down_scheduled';'time_down_unscheduled';'percent_time_down_unscheduled';'percent_known_time_down_unscheduled';'total_time_down';'percent_total_time_down';'percent_known_time_down';'time_unreachable_scheduled';'percent_time_unreachable_scheduled';'percent_known_time_unreachable_scheduled';'time_unreachable_unscheduled';'percent_time_unreachable_unscheduled';'percent_known_time_unreachable_unscheduled';'total_time_unreachable';'percent_total_time_unreachable';'percent_known_time_unreachable';'time_undetermined_not_running';'percent_time_undetermined_not_running';'time_undetermined_no_data';'percent_time_undetermined_no_data';'total_time_undetermined';'percent_total_time_undetermined';
'dbserver';'0';'0.000%';'0.000%';'632663';'100.000%';'100.000%';'632663';'100.000%';'100.000%';'0';'0.000%';'0.000%';'0';'0.000%';'0.000%';'0';'0.000%';'0.000%';'0';'0.000%';'0.000%';'0';'0.000%';'0.000%';'0';'0.000%';'0.000%';'0';'0.000%';'0';'0.000%';'0';'0.000%';
'appserver';'0';'0.000%';'0.000%';'632663';'100.000%';'100.000%';'632663';'100.000%';'100.000%';'0';'0.000%';'0.000%';'0';'0.000%';'0.000%';'0';'0.000%';'0.000%';'0';'0.000%';'0.000%';'0';'0.000%';'0.000%';'0';'0.000%';'0.000%';'0';'0.000%';'0';'0.000%';'0';'0.000%';
'SERVICEGROUP GROUPNAME SERVICE_STATE_BREAKDOWNS';
'host_name';'service_description';'time_ok_scheduled';'percent_time_ok_scheduled';'percent_known_time_ok_scheduled';'time_ok_unscheduled';'percent_time_ok_unscheduled';'percent_known_time_ok_unscheduled';'total_time_ok';'percent_total_time_ok';'percent_known_time_ok';'time_warning_scheduled';'percent_time_warning_scheduled';'percent_known_time_warning_scheduled';'time_warning_unscheduled';'percent_time_warning_unscheduled';'percent_known_time_warning_unscheduled';'total_time_warning';'percent_total_time_warning';'percent_known_time_warning';'time_unknown_scheduled';'percent_time_unknown_scheduled';'percent_known_time_unknown_scheduled';'time_unknown_unscheduled';'percent_time_unknown_unscheduled';'percent_known_time_unknown_unscheduled';'total_time_unknown';'percent_total_time_unknown';'percent_known_time_unknown';'time_critical_scheduled';'percent_time_critical_scheduled';'percent_known_time_critical_scheduled';'time_critical_unscheduled';'percent_time_critical_unscheduled';'percent_known_time_critical_unscheduled';'total_time_critical';'percent_total_time_critical';'percent_known_time_critical';'time_undetermined_not_running';'percent_time_undetermined_not_running';'time_undetermined_no_data';'percent_time_undetermined_no_data';'total_time_undetermined';'percent_total_time_undetermined';
'dbserver';'SAP DB Processes INSTANCE';'0';'0.000%';'0.000%';'632663';'100.000%';'100.000%';'632663';'100.000%';'100.000%';'0';'0.000%';'0.000%';'0';'0.000%';'0.000%';'0';'0.000%';'0.000%';'0';'0.000%';'0.000%';'0';'0.000%';'0.000%';'0';'0.000%';'0.000%';'0';'0.000%';'0.000%';'0';'0.000%';'0.000%';'0';'0.000%';'0.000%';'0';'0.000%';'0';'0.000%';'0';'0.000%';
'appserver';'SAP CCMS INSTANCE: DB Current State';'319978';'50.576%';'50.576%';'312685';'49.424%';'49.424%';'632663';'100.000%';'100.000%';'0';'0.000%';'0.000%';'0';'0.000%';'0.000%';'0';'0.000%';'0.000%';'0';'0.000%';'0.000%';'0';'0.000%';'0.000%';'0';'0.000%';'0.000%';'0';'0.000%';'0.000%';'0';'0.000%';'0.000%';'0';'0.000%';'0.000%';'0';'0.000%';'0';'0.000%';'0';'0.000%';
'appserver';'SAP CCMS INSTANCE: Log Space';'319978';'50.576%';'50.576%';'312685';'49.424%';'49.424%';'632663';'100.000%';'100.000%';'0';'0.000%';'0.000%';'0';'0.000%';'0.000%';'0';'0.000%';'0.000%';'0';'0.000%';'0.000%';'0';'0.000%';'0.000%';'0';'0.000%';'0.000%';'0';'0.000%';'0.000%';'0';'0.000%';'0.000%';'0';'0.000%';'0.000%';'0';'0.000%';'0';'0.000%';'0';'0.000%';
'appserver';'SAP Dispwork INSTANCE';'0';'0.000%';'0.000%';'632663';'100.000%';'100.000%';'632663';'100.000%';'100.000%';'0';'0.000%';'0.000%';'0';'0.000%';'0.000%';'0';'0.000%';'0.000%';'0';'0.000%';'0.000%';'0';'0.000%';'0.000%';'0';'0.000%';'0.000%';'0';'0.000%';'0.000%';'0';'0.000%';'0.000%';'0';'0.000%';'0.000%';'0';'0.000%';'0';'0.000%';'0';'0.000%';
'appserver';'SAP MessageServer INSTANCE';'0';'0.000%';'0.000%';'632663';'100.000%';'100.000%';'632663';'100.000%';'100.000%';'0';'0.000%';'0.000%';'0';'0.000%';'0.000%';'0';'0.000%';'0.000%';'0';'0.000%';'0.000%';'0';'0.000%';'0.000%';'0';'0.000%';'0.000%';'0';'0.000%';'0.000%';'0';'0.000%';'0.000%';'0';'0.000%';'0.000%';'0';'0.000%';'0';'0.000%';'0';'0.000%';
'appserver';'TCP Port 3200 (GROUPNAME_DVEB)';'0';'0.000%';'0.000%';'632663';'100.000%';'100.000%';'632663';'100.000%';'100.000%';'0';'0.000%';'0.000%';'0';'0.000%';'0.000%';'0';'0.000%';'0.000%';'0';'0.000%';'0.000%';'0';'0.000%';'0.000%';'0';'0.000%';'0.000%';'0';'0.000%';'0.000%';'0';'0.000%';'0.000%';'0';'0.000%';'0.000%';'0';'0.000%';'0';'0.000%';'0';'0.000%';
You get the problem: How can I get the average stats for the whole service group here? That's the whole point of the grouped stats.
XML to the rescue! The same report in XML format shows the averaged stats of all services (I cut the non-relevant output):
<!--?xml version="1.0" encoding="utf-8"?--> <!--?xml version="1.0" encoding="utf-8"?-->
<servicegroup_availability>
<servicegroup name="GROUPNAME">
<hosts>
<host name="dbserver">
[...]
<all_services_average>
<average_percent_time_ok>100.000</average_percent_time_ok>
<average_percent_time_ok_known>100.000</average_percent_time_ok_known>
<average_percent_time_warning>0.000</average_percent_time_warning>
<average_percent_time_warning_known>0.000</average_percent_time_warning_known>
<average_percent_time_unknown>0.000</average_percent_time_unknown>
<average_percent_time_unknown_known>0.000</average_percent_time_unknown_known>
<average_percent_time_critical>0.000</average_percent_time_critical>
<average_percent_time_critical_known>0.000</average_percent_time_critical_known>
<average_percent_time_indeterminate>0.000</average_percent_time_indeterminate>
</all_services_average>
</host></hosts></servicegroup>
</servicegroup_availability><servicegroup_availability>
</servicegroup_availability>
But how can I get the value for the field "average_percent_time_ok_known"? I already thought of some complicated sed command when I came across the command xml_grep. This command basically does the same as grep, but is specialized on xml documents. With the parameter --text_only you can retrieve the value of the grepped field. xml_grep is part of the xml-twig-tools package, which can easily be installed:
$ sudo apt-get install xml-twig-tools
The full command to retrieve the wanted value from the Icinga availability stats:
$ curl -s -u "${icingauser}:${icingapass}" "http://icinga.example.com/cgi-bin/icinga2-classicui/avail.cgi?show_log_entries=&servicegroup=GROUPNAME&timeperiod=lastmonth&rpttimeperiod=24x7&assumeinitialstates=yes&assumestateretention=yes&assumestatesduringnotrunning=yes&includesoftstates=no&initialassumedservicestate=6&&rpttimeperiod=24x7backtrack=8&content_type=xmloutput&xmloutput" | xml_grep "average_percent_time_ok_known" --text_only
100.000
Quick and painless (for the brain).
Update November 12th 2020
It's not really relevant to this article as this article is about how to retrieve an XML value with Bash. But in case you stumbled on this article to find out how to create Icinga 2 SLA statistics this information might be relevant to you. As described in article Icinga2-classicui is gone after installing Icinga2 2.10, the Icinga2-classicUI interface is gone and cannot be used anymore. Check out a follow-up article (Create SLA availability statistics and reports from Icinga 2 monitoring) on alternative ways to create SLA reports.
No comments yet.

AI AWS Android Ansible Apache Apple Atlassian BSD Backup Bash Bluecoat CMS Chef Cloud Coding Consul Containers CouchDB DB DNS Databases Docker ELK Elasticsearch Filebeat FreeBSD Galera Git GlusterFS Grafana Graphics HAProxy HTML Hacks Hardware Icinga Influx Internet Java KVM Kibana Kodi Kubernetes LVM LXC Linux Logstash Mac Macintosh Mail MariaDB Minio MongoDB Monitoring Multimedia MySQL NFS Nagios Network Nginx OSSEC OTRS Observability Office OpenSearch PHP Perl Personal PostgreSQL PowerDNS Proxmox Proxy Python Rancher Rant Redis Roundcube SSL Samba Seafile Security Shell SmartOS Solaris Surveillance Systemd TLS Tomcat Ubuntu Unix VMware Varnish Virtualization Windows Wireless Wordpress Wyse ZFS Znuny Zoneminder